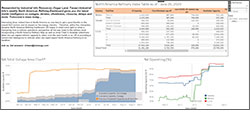
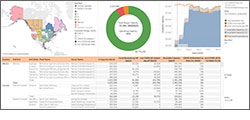
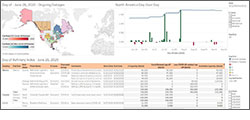
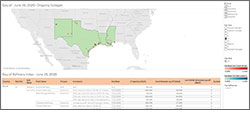
Now you can visualize, in clear and concise fashion, IIRís key fundamental refinery operations data for the North American market in an easy-to-use, powerful analytical Tableau interface.
IIRís refinery dashboard allows you to see and analyze the refinery supply picture, including past, current and future runs, with the ability to drill down to the unit level. Understand market dynamics better, and position yourself in these volatile times with more confidence using the new IIR dashboard.
If you have any questions regarding the energy market, please contact
iirteam@iirenergy.com or call (713)-980-1779
|

 View Overview Sample
 View Refinery Sample
 View Ongoing Outages Sample
 View Ongoing Outages Sample