EnergyLive
EnergyLive Database
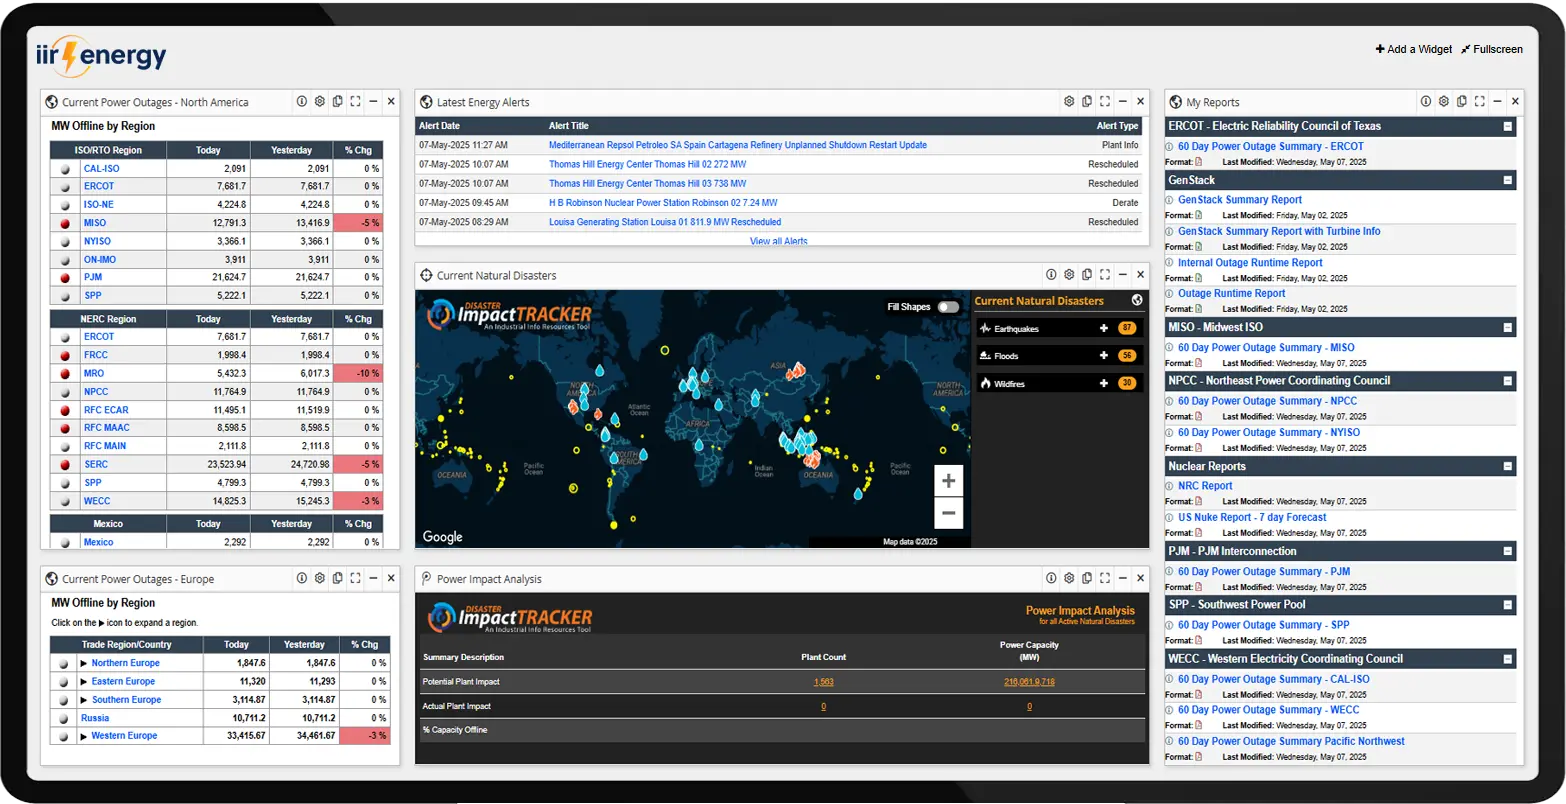
EnergyLive is our customizable dashboard for quick access to database searches, reports, widgets, alerts, maps, and more. Save research time with this one-stop shop that houses all IIR research tools, reports, and access to our research teams.
One Dashboard for All Your Market Intelligence
Access plant, unit, and project databases, reports, widgets, news and more in a single customizable interface.
Constantly Updated Visibility
Monitor unit level changes, offline events, capacity updates and sector wide trends across power, refining, gas and petrochemicals.
Power Generation Dashboard
Petroleum Refining Dashboard
Petrochemicals Dashboard
Custom Alerts and Analytics Tools
Set up notifications, dashboards and exportable data views to stay ahead of market movements and operational risks.
Streamline Your Workflow
Replace spreadsheets and scattered tools with EnergyLive’s unified platform for faster insights and decision making.
Learn more about how EnergyLive can enhance your analysis today.
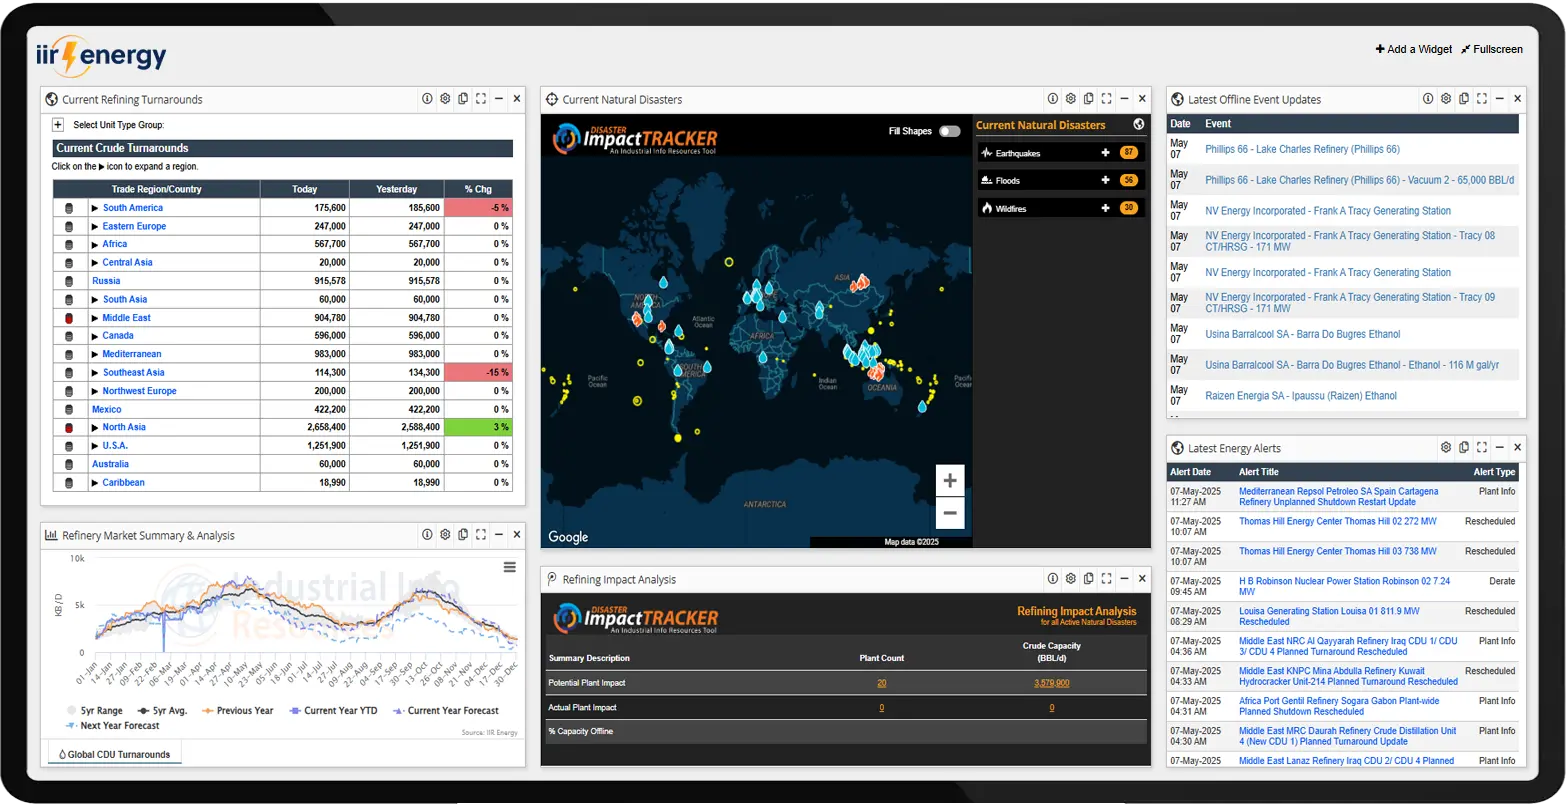
Access EnergyLiveRefinery Capacity Insights
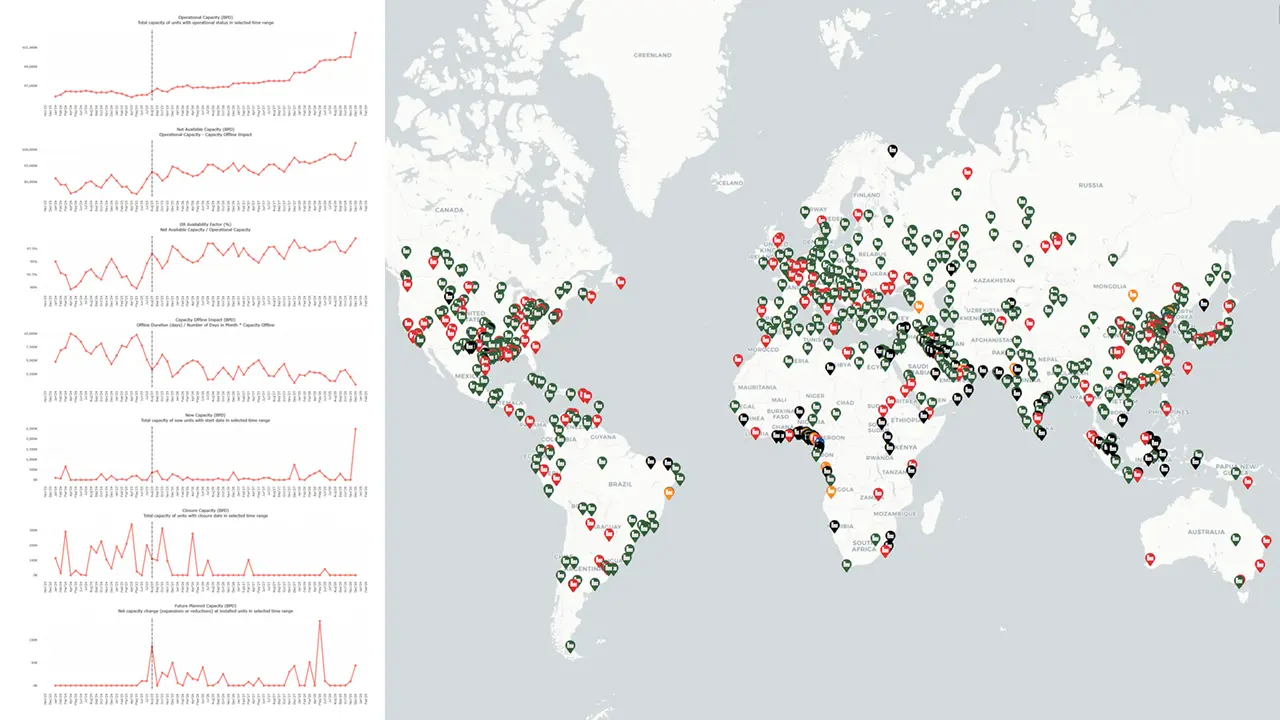
Refinery Capacity Insights (RCI)
Visualize refinery capacities, outages, and trends over time for deeper analysis.
Instant Unit Capacity Visualization
See refinery unit changes, additions, closures, and offline events across 10+ unit categories, including CDUs, Cokers, and Alkylation, in one view.
Complete Historical and Future Trends
Analyze monthly refinery data from 2015 and project capacity developments through 2035 and beyond.
Customizable Drill-Downs and Aggregates
Explore data at the refinery level or summarize by trading region, country, or global totals for strategic insights.
Planned vs. Unplanned Event Insights
Compare historical and future offline events and capacity impacts, with export-ready data for quick analysis.
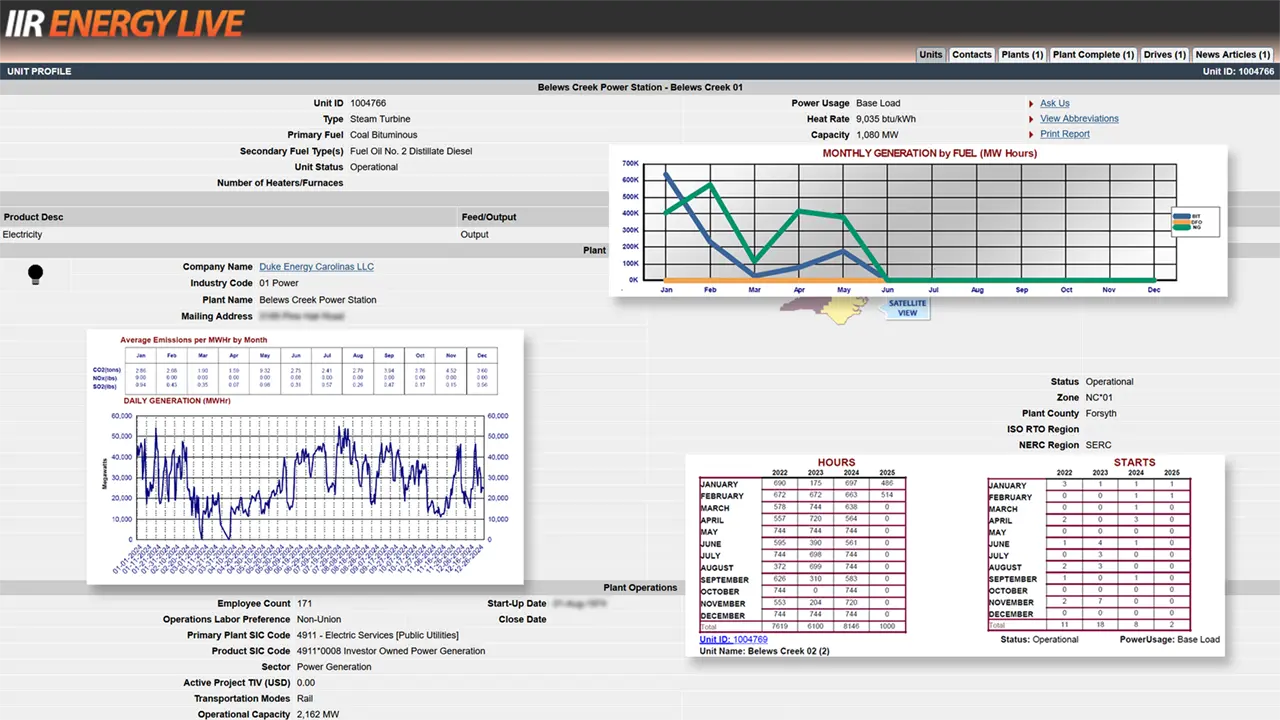
GenStack
GenStack
Track actual power generation, emissions, and runtime data across U.S. plants.
Power Generation Data Mapping
Map unit-level power generation data directly from EIA/EPA CEMS to IIR’s Plant and Unit Databases.
Detailed Runtime and Emissions Data
Access total start-up times, hourly runtimes, and runtime percentages for every unit across the U.S. power grid alongside NOx, SO₂, and CO₂ emission data.
Flexible Time-Granularity
Analyze power generation and operational performance via monthly summaries or drill down to hourly and daily history (GenStack Enhanced).
Fuel-Type Analysis
View monthly generation by fuel type to assess trends, operational changes, and market impacts.
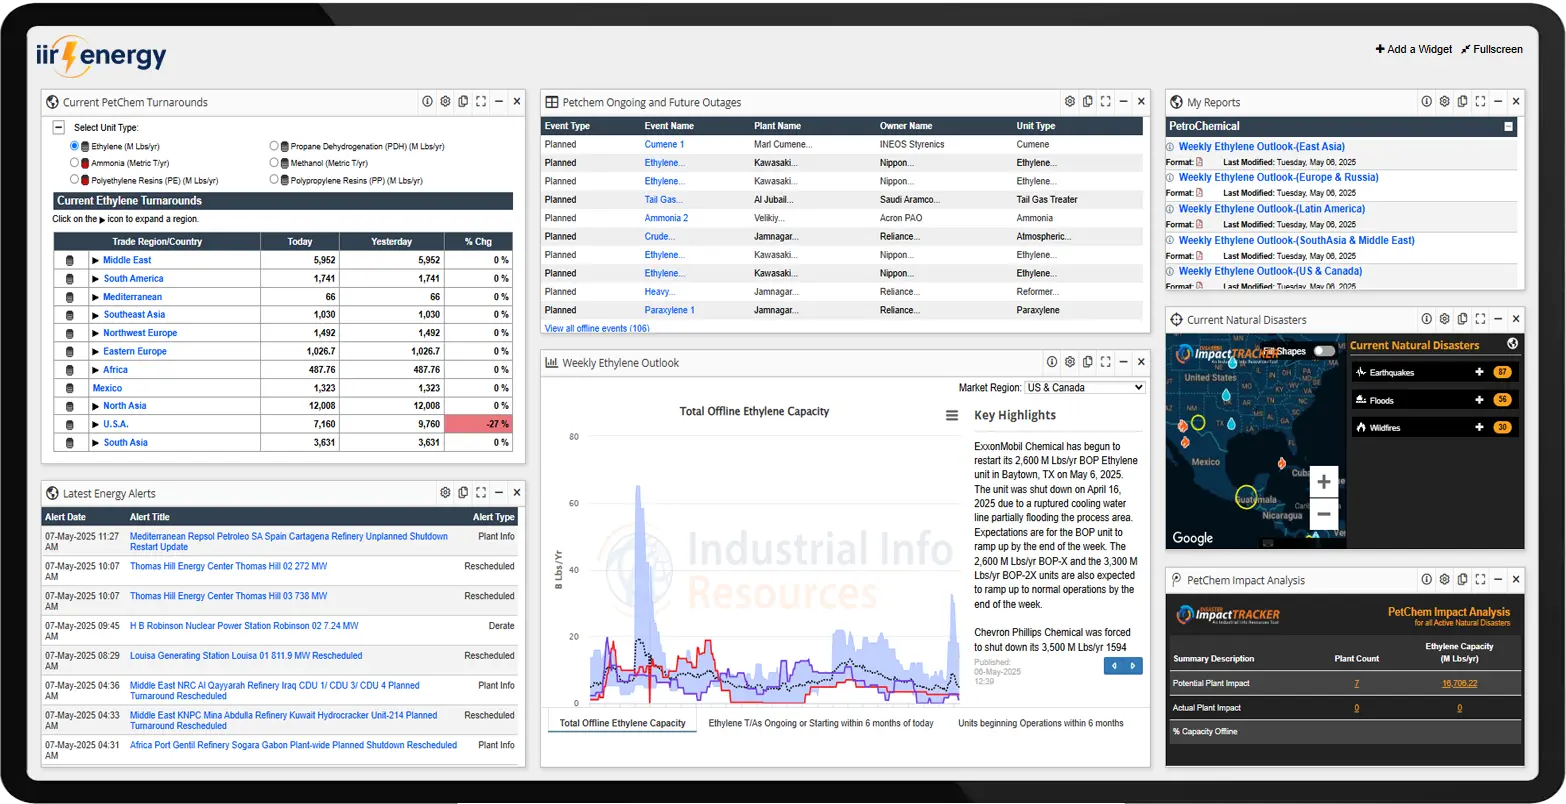
Disaster Impact Tracker
Disaster Impact Tracker
Monitor natural disasters and their impacts on energy assets in real time.
Real-Time Disaster Monitoring
Track hurricanes, earthquakes, floods, fires and other events as they happen with live intensity and weather data.
Visualize Impacted Energy Assets
Instantly see plant locations and capacity totals in the path of disasters.
Assess Offline and At-Risk Capacity
Analyze potential and actual plant outages caused by natural disasters with direct access to plant profiles for smarter models.
Overlay Weather
Anticipate disasters before they happen with easy-to-use wind, precipitation, cloud, and temperature weather layers.
GeoXplorer
GeoXplorer
Visualize and analyze plants, projects, and energy infrastructure on an interactive map.
Interactive Map Based Analysis
Visualize plants, units, offline events, projects, pipelines and transmission lines on a powerful GIS dashboard.
Custom Layer Overlay
Add weather patterns, regional boundaries, power grids and more to enhance your data context and market insight.
Smart Polygon & Region Tools
Use drawing tools to group and analyze assets by trading region, country or custom zones for deeper segmentation and strategy.
Export Ready Insights
Drill into detailed unit and asset level data and export results for reports, presentations or downstream analytics.
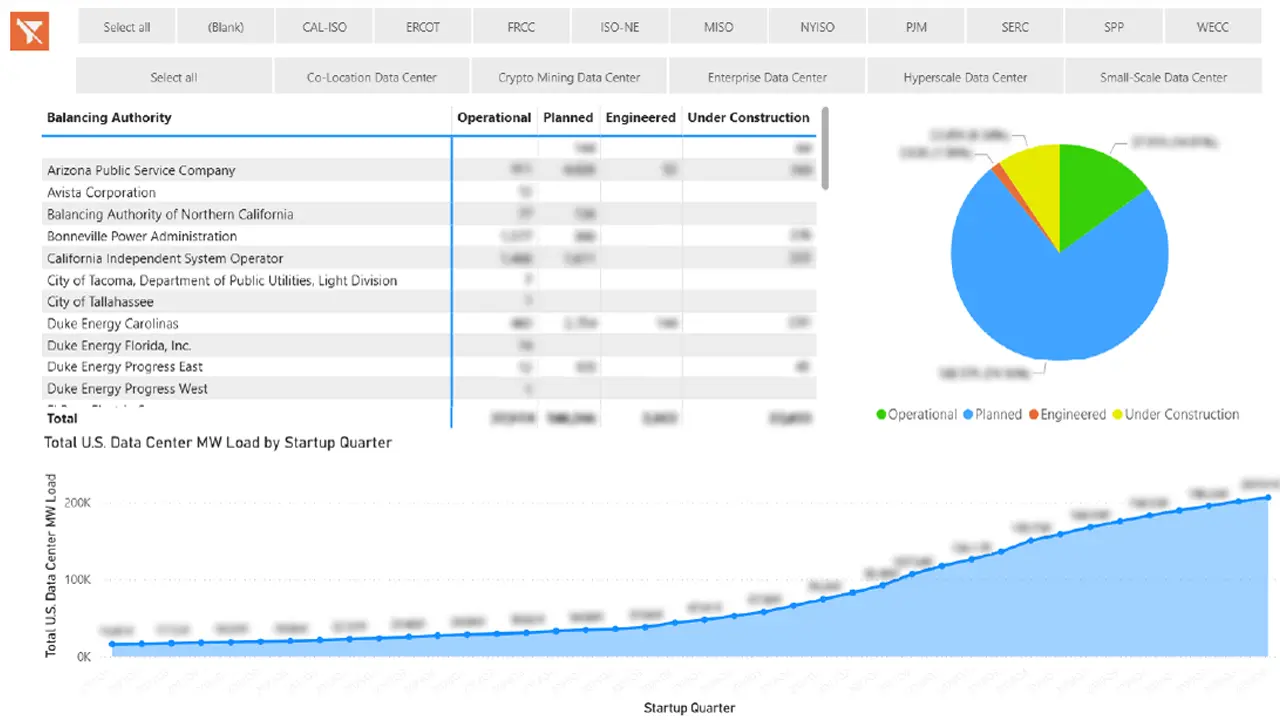
U.S. Data Center Summary
U.S. Data Center Summary
Track electricity demand growth and forecasts for U.S. data centers.
Track Electricity Demand Growth
Monitor U.S. data center electricity consumption over time, including Bitcoin mining, co-locations, and data warehouses.
Comprehensive Capital Project Coverage
Follow new builds, expansions, and upgrades for data centers globally to anticipate load impacts.
Detailed Plant & Unit Profiles
Access on-site power generation units, backup systems, and equipment specifications for every facility.
Capacity & Mapping Insights
View capacity by plant, unit, and project in megawatts and square feet, mapped to NERC, ISO, RTO, Balancing Authority, and Electric Utility connections for precise energy planning.
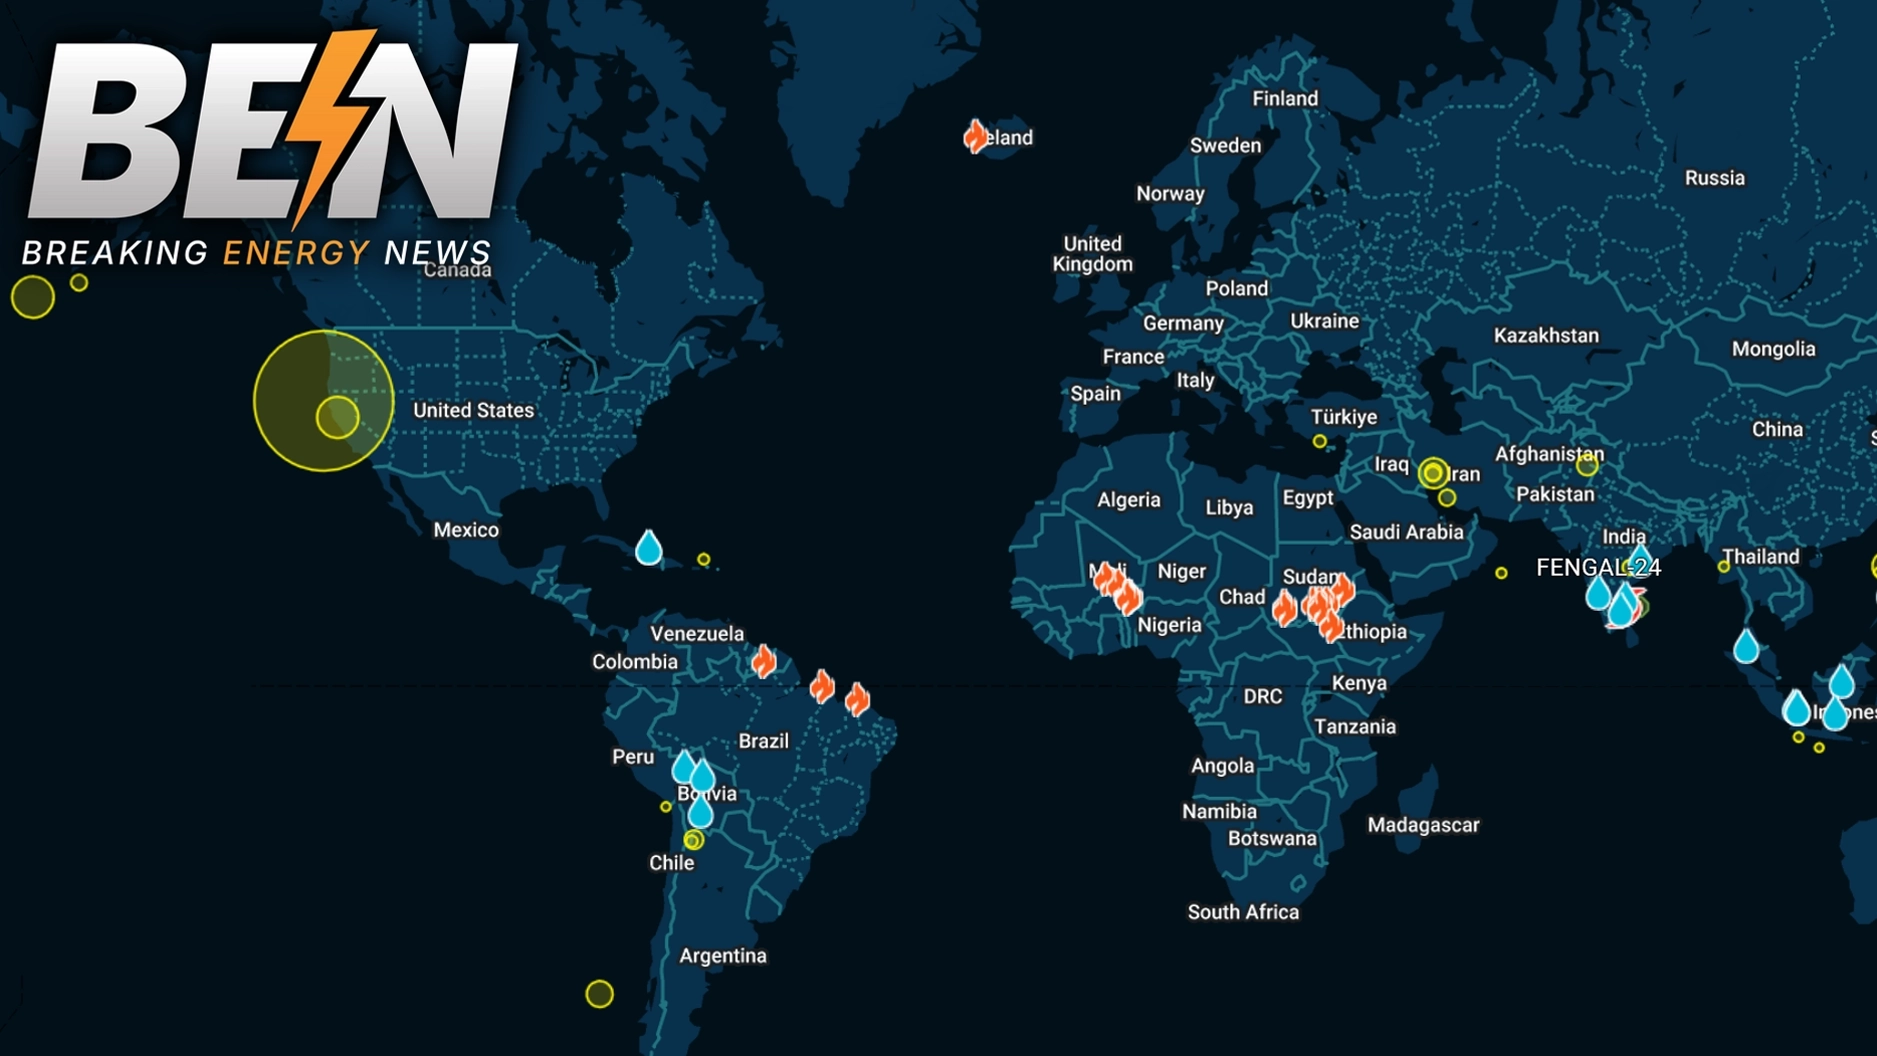
BEN
Breaking Energy News
With BEN, stay up-to-date on events that move the market.
Learn More About BENExpert Interpreted Insights
Our tenured market experts and Ph.D. meteorologists turn trusted data into clear, actionable insights.
Energy Market Coverage
Keep up with the stories that matter most across the energy landscape, including Power, Nat Gas, and Refining Markets.
Access Impacted Facilities
Review news with direct access to impacted plants, units, offline events, and projects.
Disaster Impact Mapping
View the active disaster map and access a list of potential/actual plant disaster impacts.