
Access 40+ Years of Trusted Energy Market Research and Insights
With our trusted data, you can uncover trends, predict price movements, and gain a competitive edge in the fast-evolving energy sector.
Learn More About IIR EnergyWith our trusted data, you can uncover trends, predict price movements, and gain a competitive edge in the fast-evolving energy sector.

Serving Traders, Analysts, Asset Owners, and Other Market Participants
Our platform caters to traders taking market positions, analysts researching energy fundamentals, and asset owners seeking long-term investments.
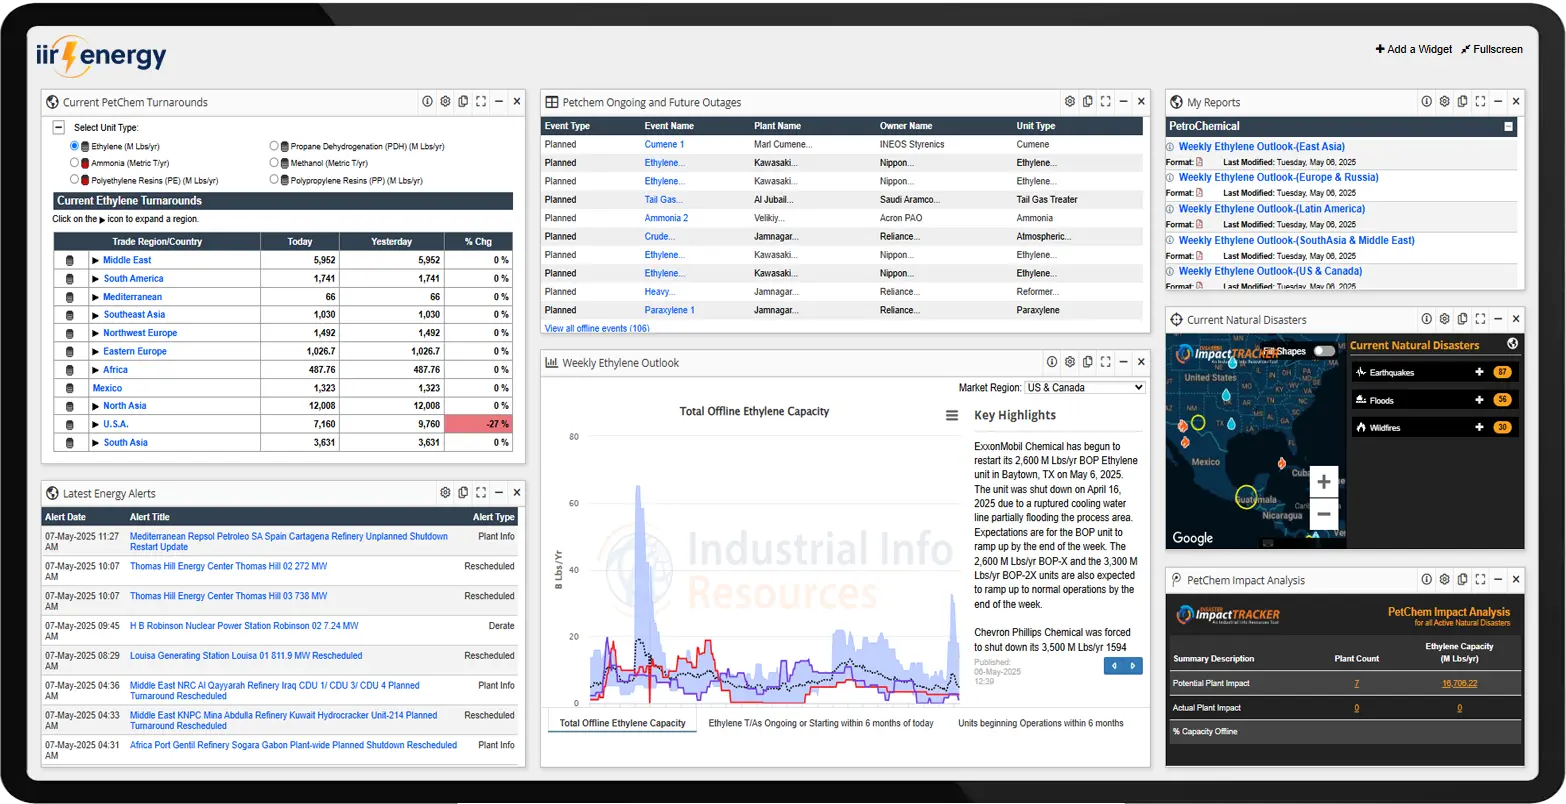
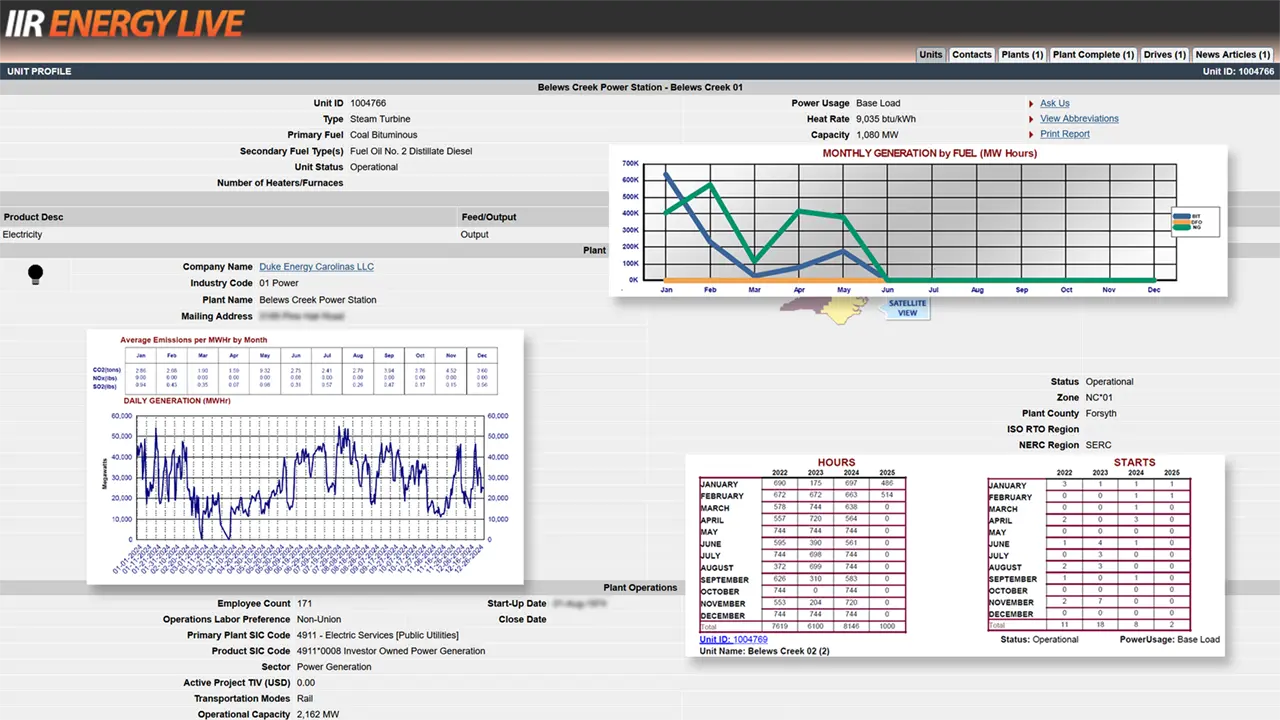
Discover Our EnergyLive ToolsOur platform caters to traders taking market positions, analysts researching energy fundamentals, and asset owners seeking long-term investments.

Providing Clarity in an Ever-Changing Energy Market
Our extensive historical and real-time insights enable informed decision-making, helping you navigate market complexities with confidence and precision.
Explore IIR News Intelligence & InsightsOur extensive historical and real-time insights enable informed decision-making, helping you navigate market complexities with confidence and precision.
Our Coverage
Trusted Intelligence Across the Energy Landscape
From power generation to petrochemicals, IIR Energy tracks industrial projects and trends that shape the future of global energy supply.


40+
Years of business
15
Offices worldwide
59
Languages globally
315K+
Operational plants researched globally
Our Research Layers
Exploring the Layers of Research That Drive Our Insights
Our detailed database is organized by research layers to give you the level of information you need. Users stay informed by the continuous updates our research team makes to the detailed database we’ve built over 40 years.
Our Energy Reports
Our Energy Reports
Our reports are designed for energy commodity traders and analysts, helping you develop deeper insights and make faster, more accurate decisions. Gain quick access to reliable data from IIR Energy reports to save time and trade with confidence.


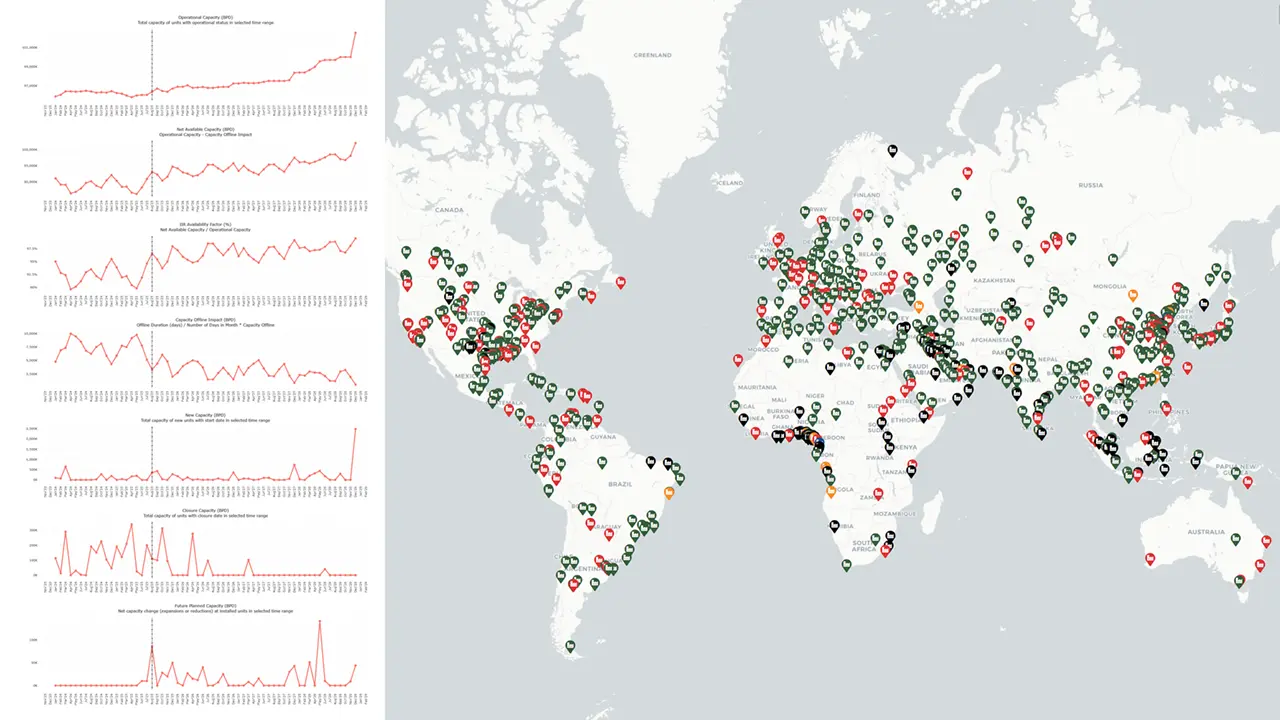
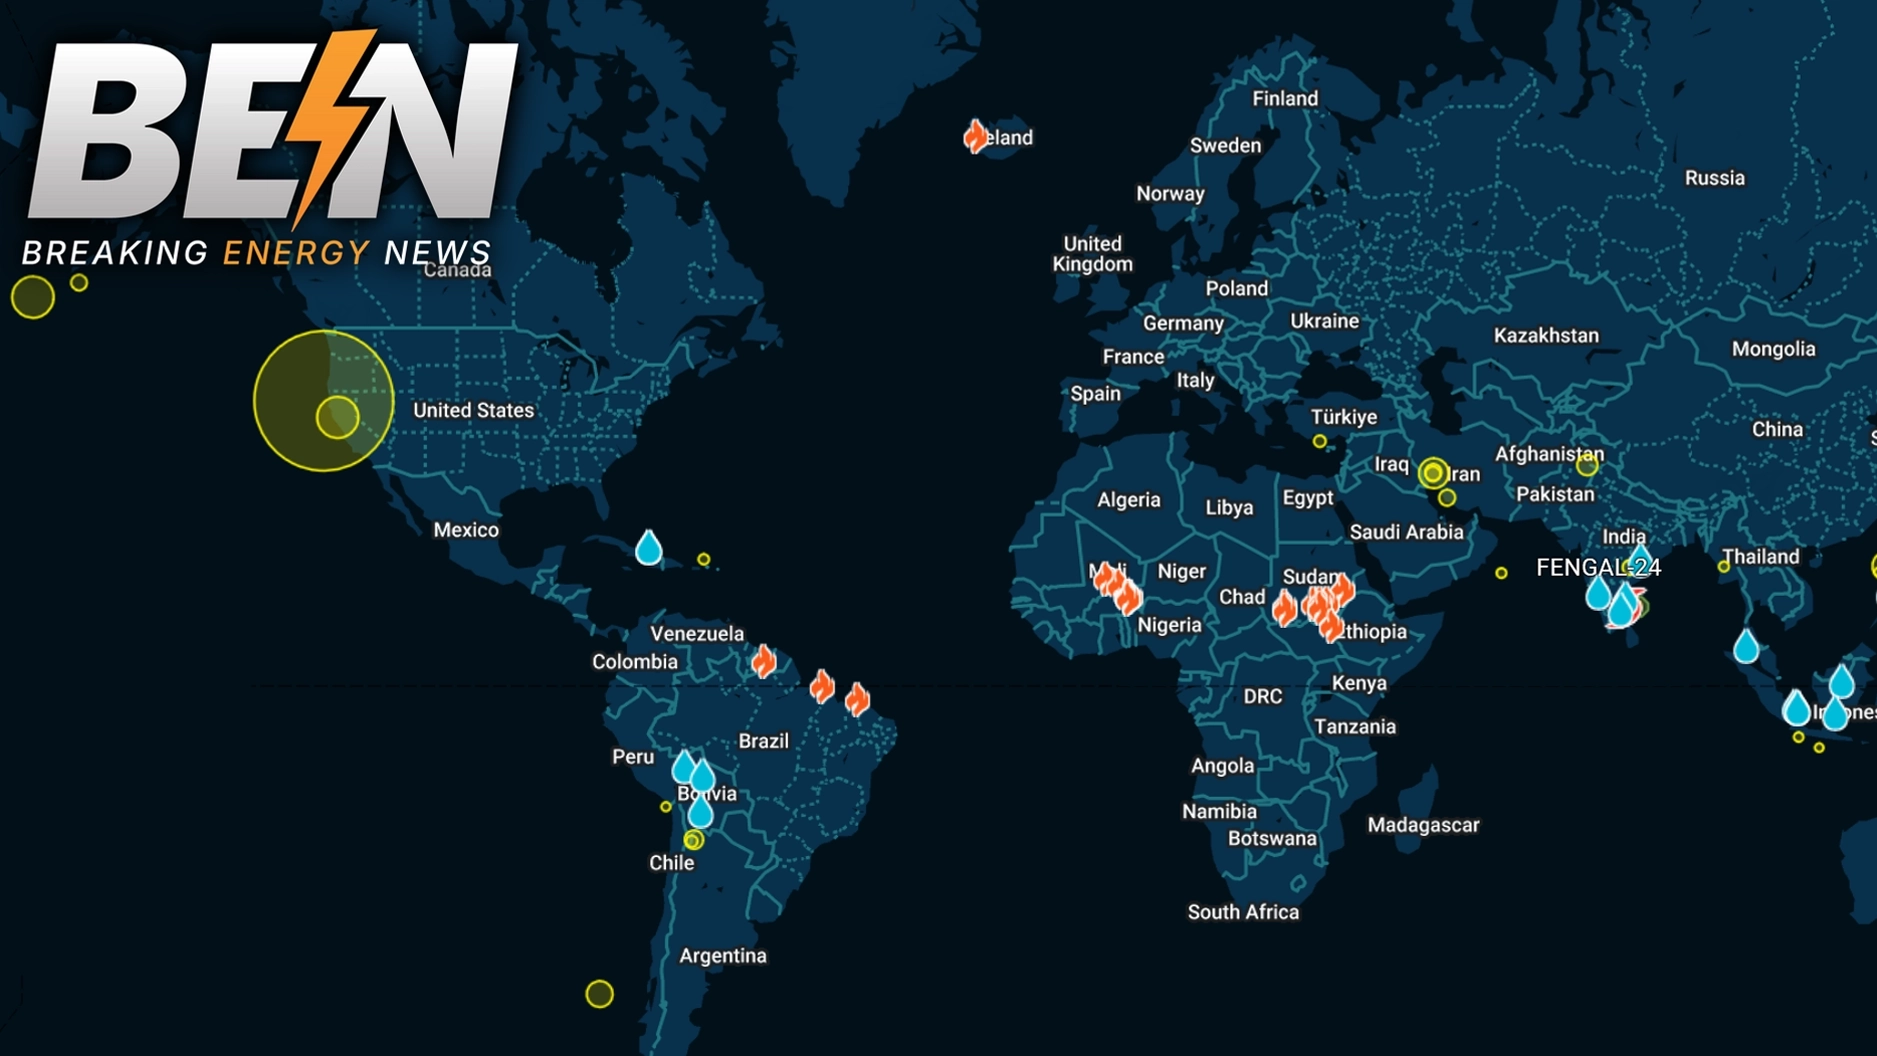
Industry Heat Maps
Interactive Heat Maps
View hotspots for CapEx TIV, Plant Counts, Capacity, and Outage Counts on each industry we cover.
Data Updated -
News
IIR News Intelligence
View more articlesIIR News Intelligence
Subscribe to our newsletter for daily industrial market insights.
Read The Article
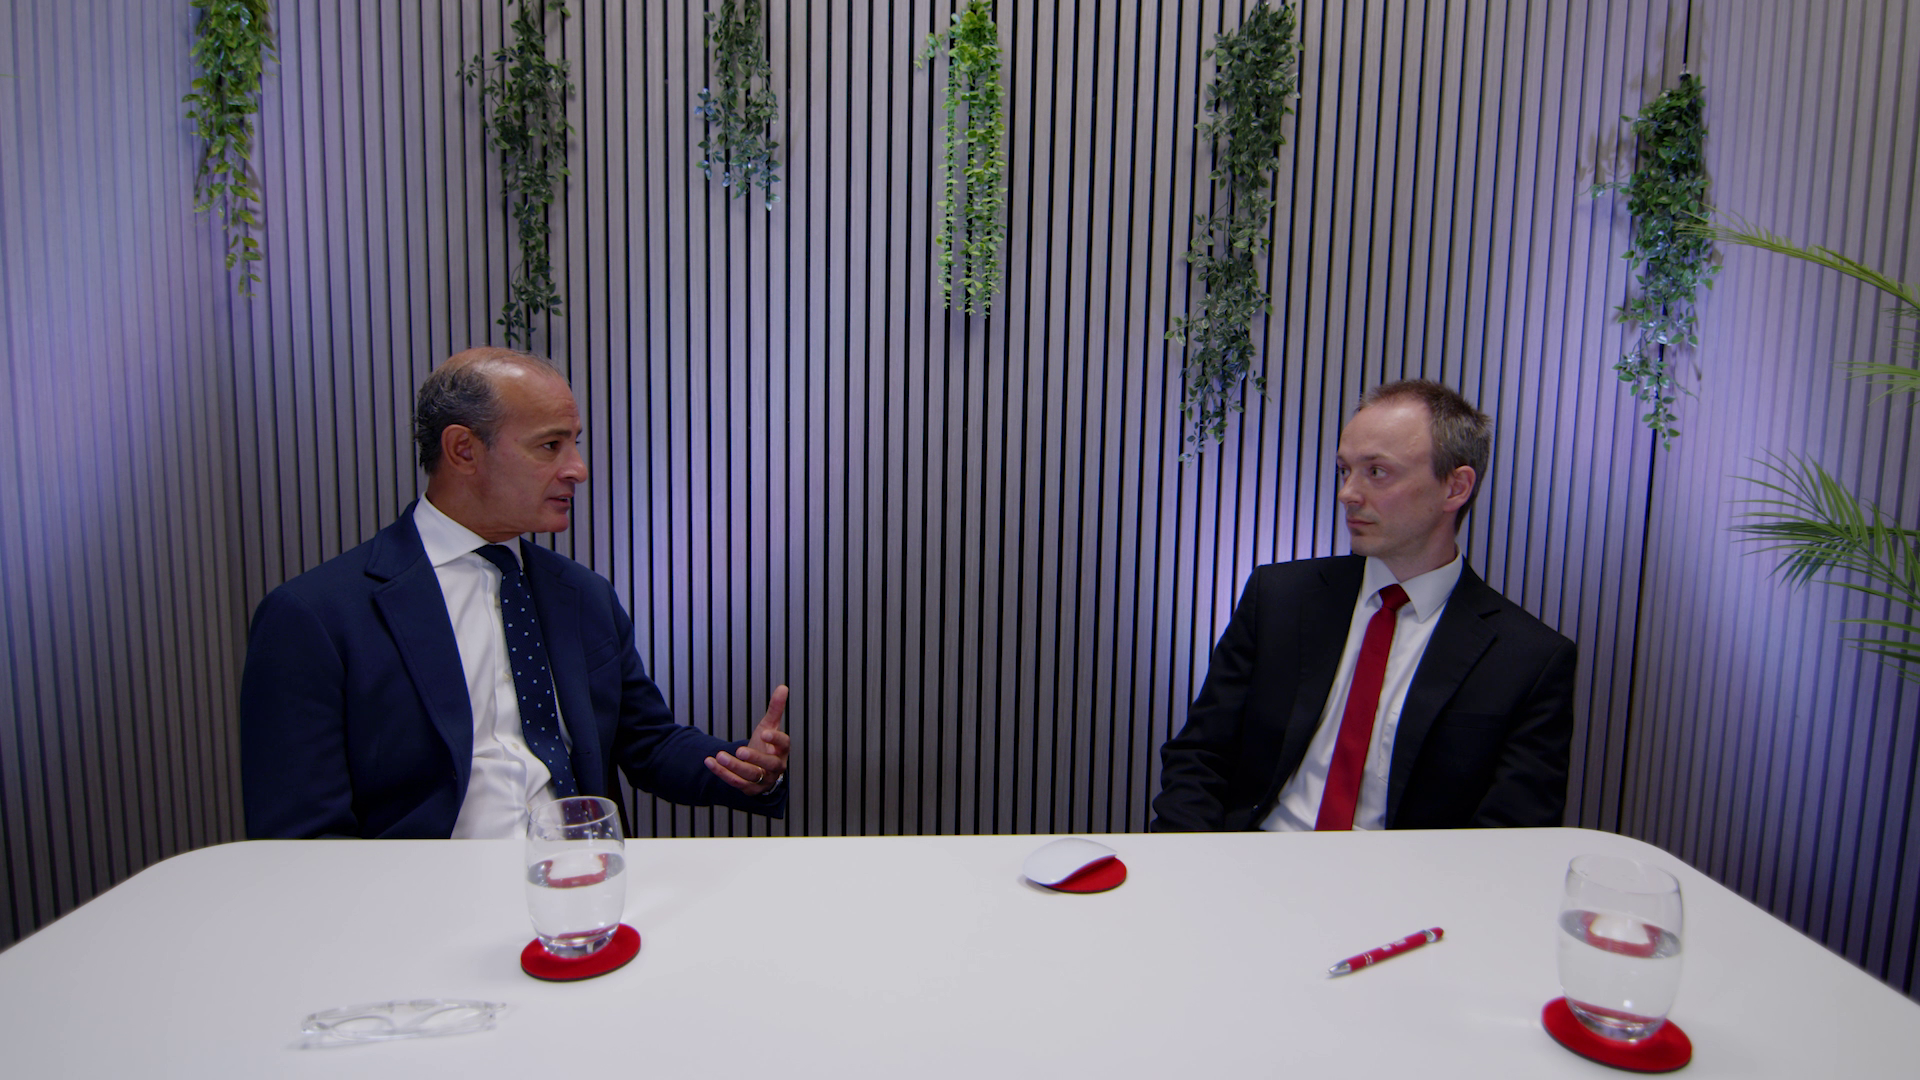
Latest Podcast Episodes
Browse All Episodes
Chemical Processing & Alternative Fuels
European Chemicals and Transport Fuels Outlook
Explore a data-backed look at supply disruption, decarbonization, and investment trends in European chemicals and transport fuels.
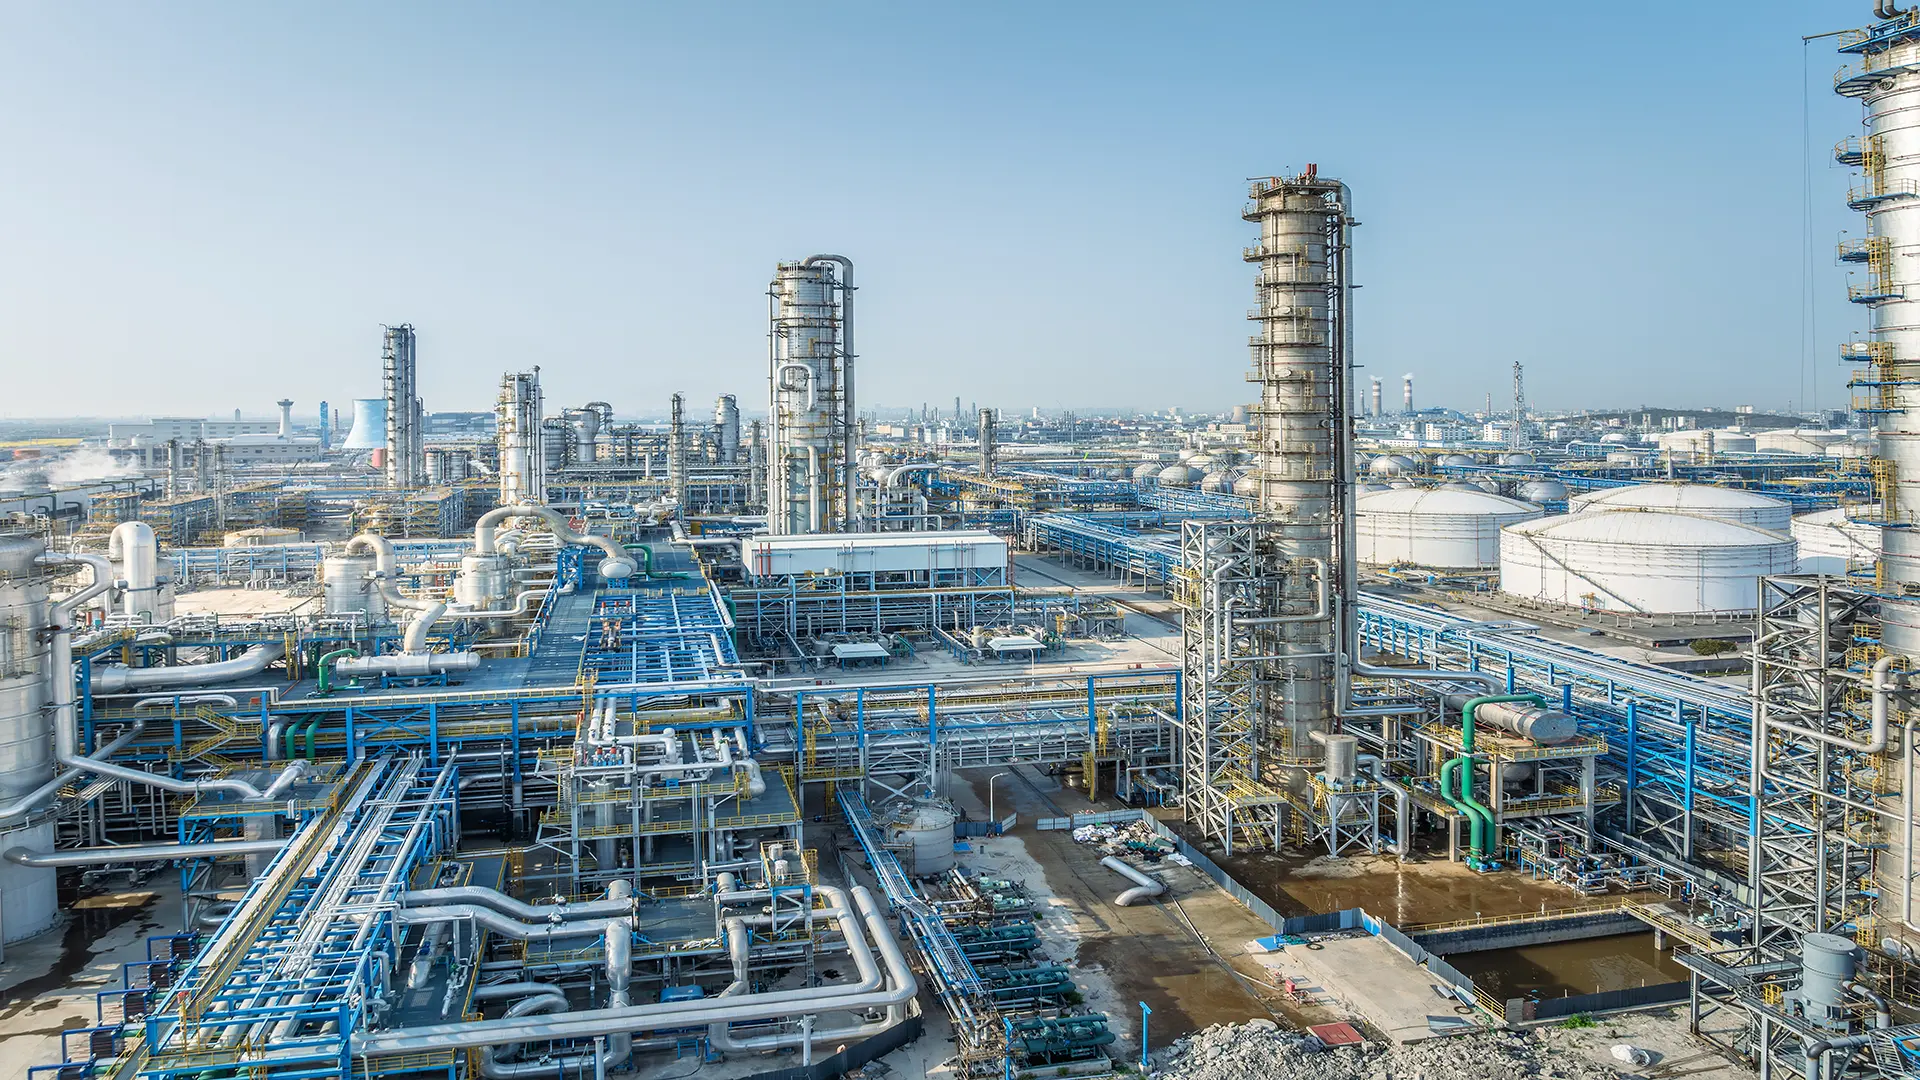
Petroleum Refining
2026 European Petroleum Refining Project Outlook
Explore the pressures of the energy transition, capital flows, and decarbonization in European petroleum refining.
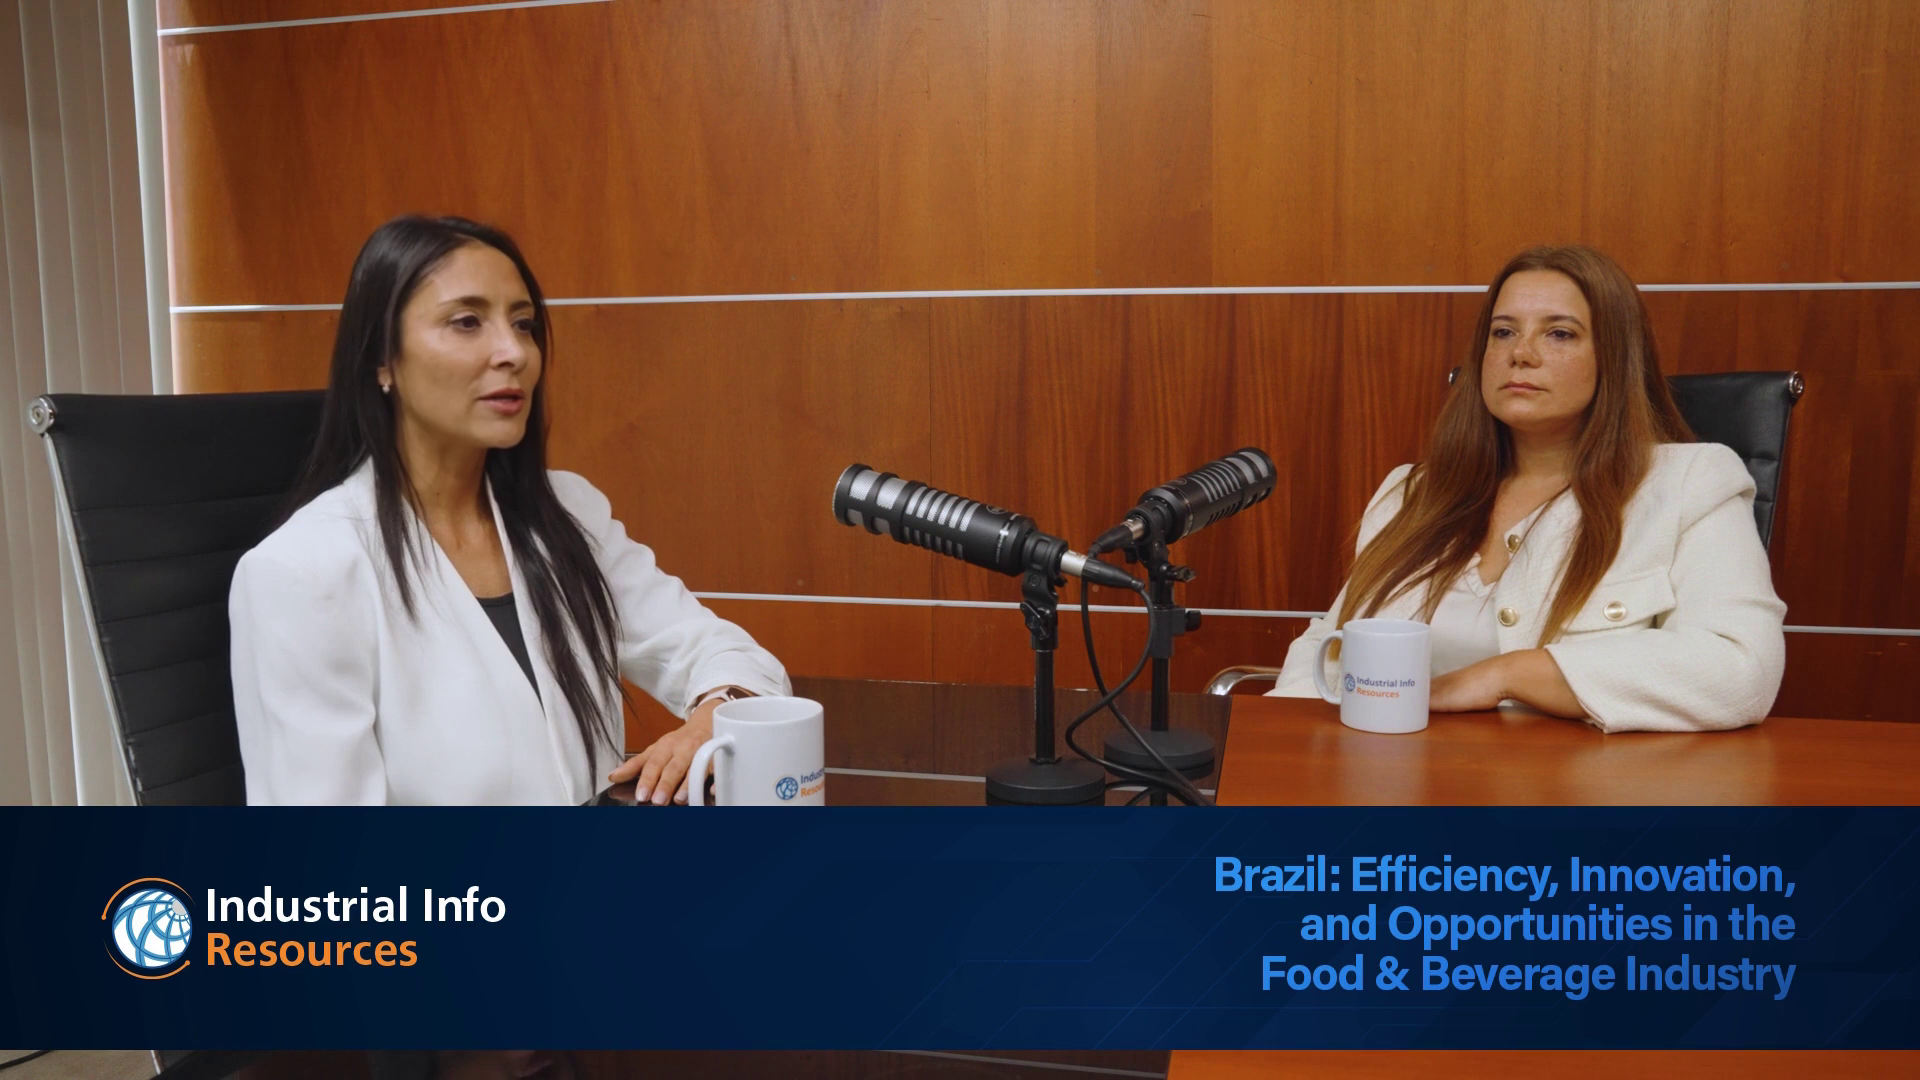
Food & Beverage
Brazil: Efficiency, Innovation, and Opportunities in the Food & Beverage Industry
Discover how Brazil's food and beverage industry integrates efficiency, automation, and innovation to drive future growth.
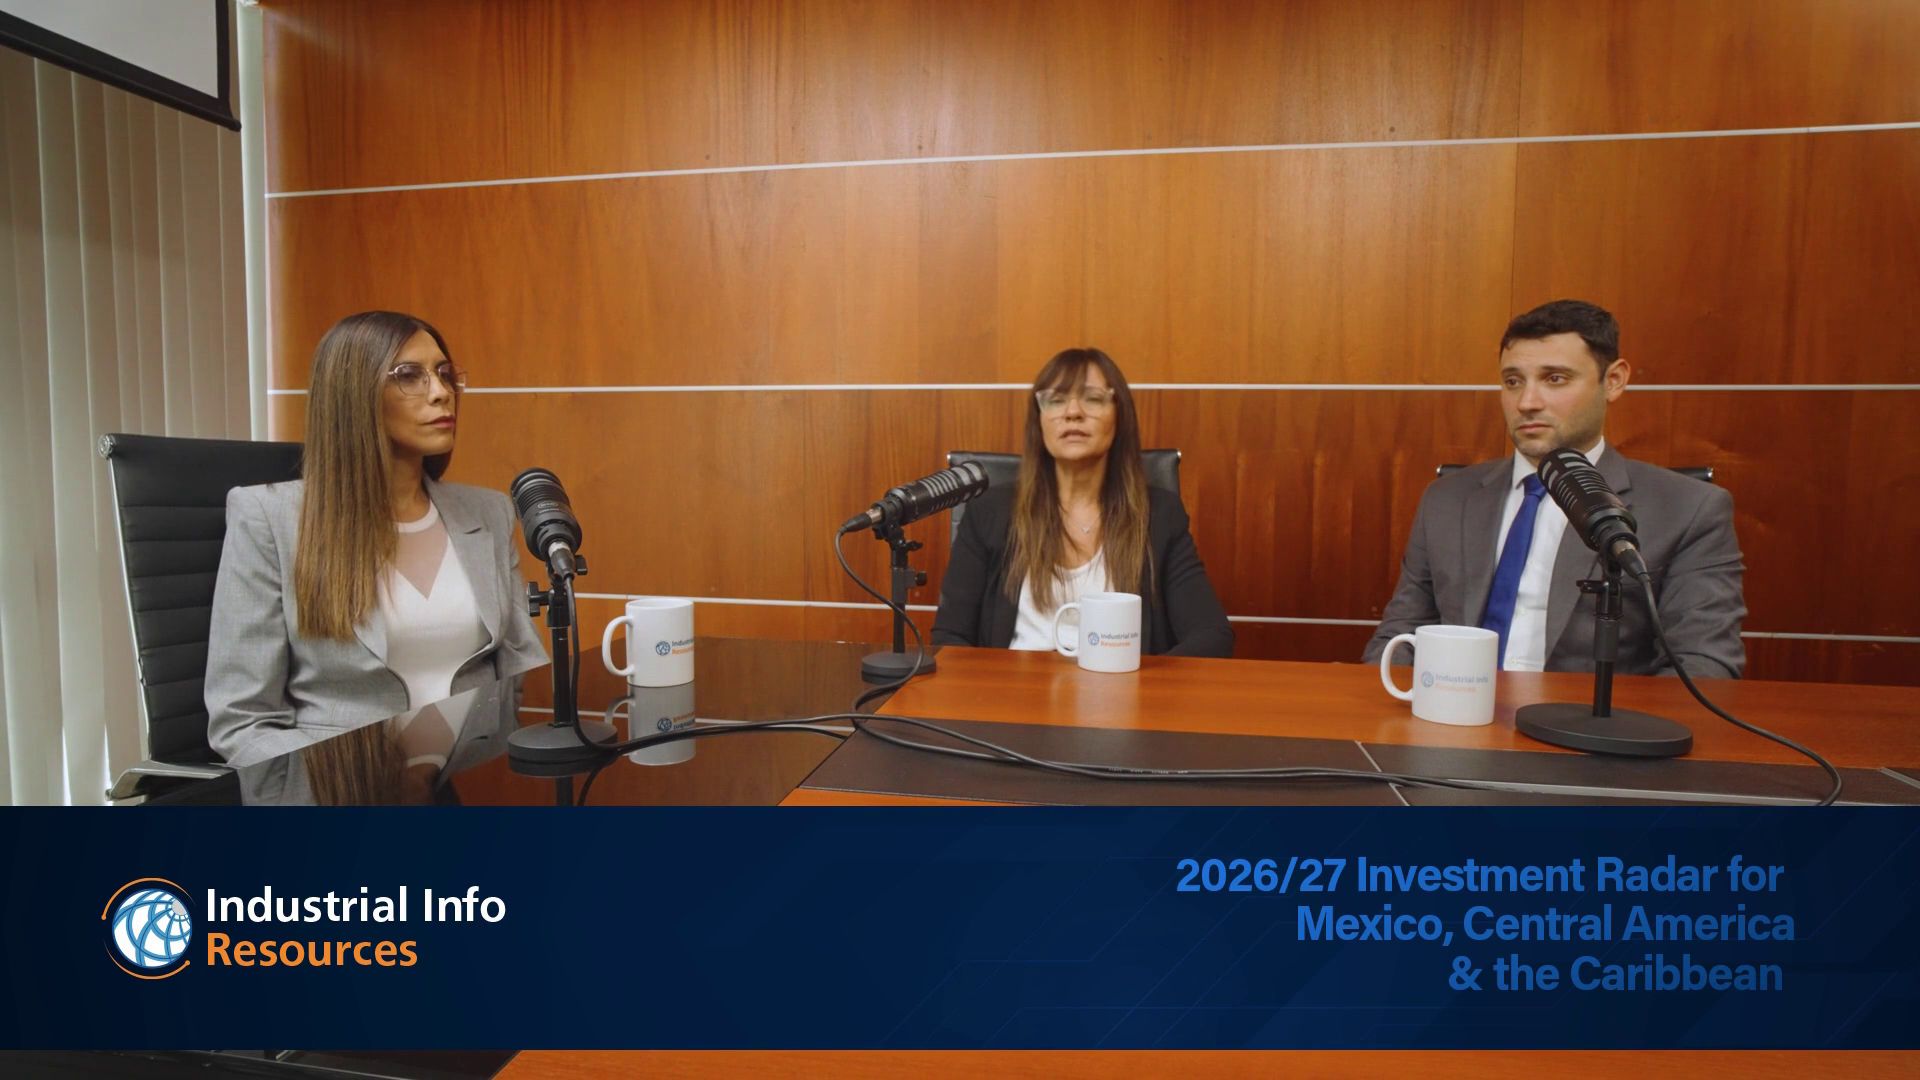
All Industries
2026/27 Investment Radar for Mexico, Central America & the Caribbean
Uncover key 2026/27 investment trends in Mexico, Central America, and the Caribbean, balancing growth with regional challenges.
Industry White Papers
Browse All White Papers
Labor Market
2026 United States Labor White Paper
A new era of policy-driven capital spending. The U.S. industrial and energy construction sectors are presently shaped by a confluence of macroeconomic and legislative forces.

Pharmaceutical & Biotech
Global Pharma and Biotech Capital Outlook 2026
The global pharmaceutical and biotechnology sector is entering a period of robust capital spending, driven by a structural shift toward outsourcing and an urgent need for advanced manufacturing capabilities.

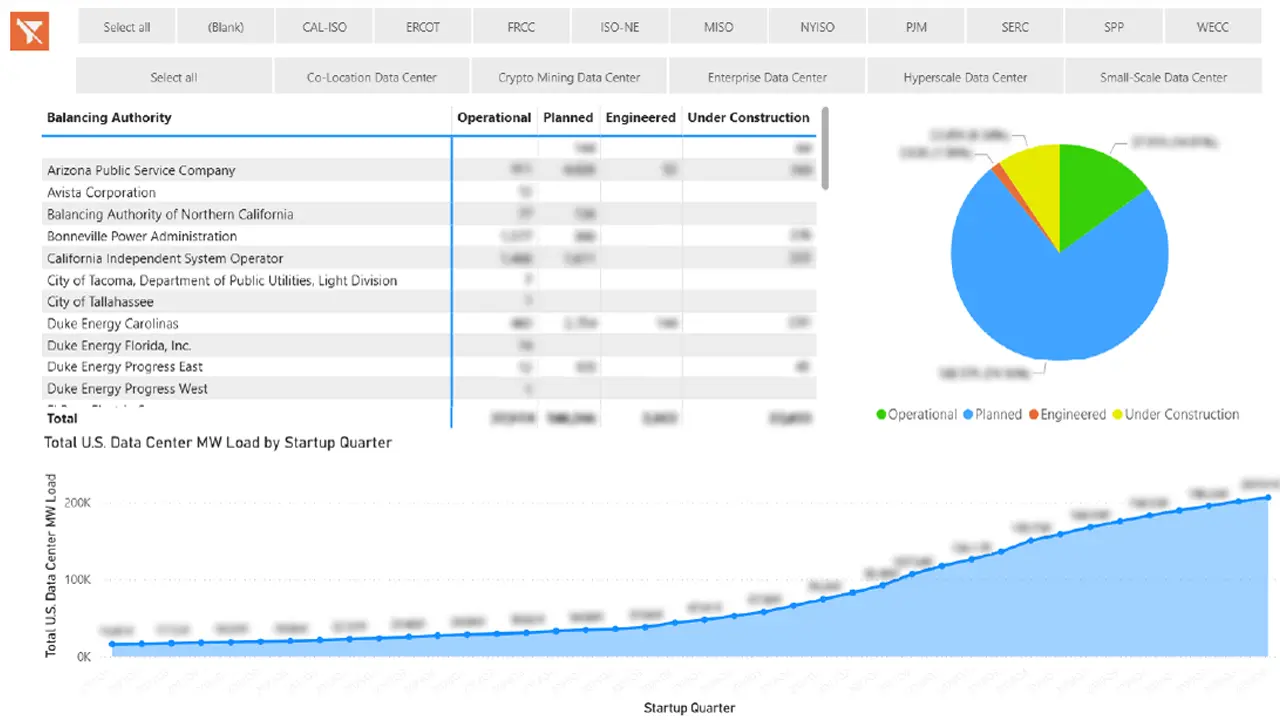
Data Centers
Power Generation for AI Driven Data Centers: Trends and Innovations
Data center infrastructure is expanding at a remarkable rate, driven largely by advancements in artificial intelligence and automation.
Chemical Processing
2026 Regional Chemical Processing Outlook
This white paper examines the current and future landscape of the global chemical processing industry, analyzing how macroeconomic deceleration and shifting geopolitical dynamics are recalibrating capital spending.
Our Global Reach
Powering Intelligence Across the Globe
Whether you have questions about our market intelligence, need technical support, or want to access our data, our team is ready to help. With 4 IIR Energy sales offices and 15 Industrial Info Resources research offices worldwide, we connect you to the expertise and insights needed for informed energy decisions. Our global presence ensures expert support is available 24/7 to empower your analysis, trading, and strategic planning with actionable market data.

Our Alliance Partners