Written by John Egan for IIR News Intelligence (Sugar Land, Texas)
Summary
The U.S. produced and consumed energy differently in 2025 compared with most of the rest of the world, increasing carbon dioxide emissions while others were lowering emissions; sharply boosting coal use while others were cutting back; and growing oil production and consumption as many other countries did the opposite, according to the Energy Institute's annual "Statistical Review of World Energy 2026." But when it came to total energy supply and deployment of non-emitting generation and battery storage, domestic trends mirrored overseas ones.Five Takeaways and a View from the Top
The 88-page report, which for most of its 75 years was prepared by BP, was released amid a searing early-summer heatwave across Europe and the U.S. Many climate scientists have said increased use of fossil fuels is accelerating global warming. The United Nations' "State of the Global Climate" report, released earlier this year, found that the last 11 years, 2014-2025, were the 11 hottest on record.The EI report identified several key trends shaping the global energy system:
- The Middle East wars, like the Russian invasion of Ukraine in 2022, have given new urgency to energy security, with different paths being chosen by different economies. "Europe has reduced reliance on Russian gas but remains exposed to supply risks from alternative exporters," the report said. "The U.S. has largely reversed its (import) dependence through domestic production growth. China has strengthened domestic supply of gas and coal, but it continues to rely heavily on imports to meet oil and gas supply needs."
- Renewables increasingly are being used to bolster energy security. For example, wind and solar have saved Europe about US$25 billion in avoided fossil-fuel imports over the 2022-2025 period.
- Renewables and natural gas have displaced oil as the main ways the world is meeting growing energy demand.
- Economic growth continues to be uncoupled from fossil fuel use. "In the last decade," the report said, "fossil-fuel consumption has grown at an average growth rate of 1% per year, while GDP has grown about 2.7% annually."
")
U.S. Total Energy Supply Growth Outstrips Many Nations
U.S. total energy supply (TES) grew faster last year than the global average and many other leading economies, according to the 75th annual edition of the "Statistical Review of World Energy" a comprehensive annual report prepared by the EI and released June 30.U.S. TES grew about 2.2% last year, faster than the global average of approximately 1.7% and the 2025 TES growth rates of India (1%), France (0.5%), Germany (0.1%), Russia (-0.3%), Japan (-0.5%) and the UK (-1%).
Some of that divergence between the U.S. and the rest of the world stemmed from the plentiful U.S. resource base, but some also flowed from decisions made by the Trump administration.
Globally, the EI report said, TES hit a new record of in 2025 of about 600 exajoules (EJ), the second year in a row that world energy use set a new record. It said all major energy sources contributed to the growth of TES.
") By the Numbers
By the Numbers- 1.7%: The gain in total energy supplied around the world in 2025.
- 2.2%: The increase in U.S. total energy supplied in 2025.
- 10.4%: Increase in coal use in the U.S. in 2025, which grew about 13 times faster than the global increase of 0.7% last year.
- 3.1%: Growth of CO2 emissions from energy in the U.S. last year, roughly triple the percentage gain in global CO2 emissions from the energy ecosystem.
Carbon Dioxide Emissions
That gap between the U.S. and other nations is particularly notable in carbon dioxide (CO2) emissions from energy, which last year rose 3.1% in the U.S., following a decade when they fell approximately 0.8% per year for the decade before that, the EI report said.Global CO2 emissions from energy increased 1.1% in 2025, a slight increase over annual emissions gains of about 0.9% for the prior decade, as the U.S., and fast-growing economies in the developing world increased their use of coal to generate electricity.
CO2 emissions from China and India grew, but at a slower pace compared to the prior decade: China's emissions increased about 0.7% in 2025, far less than that country's annual emissions growth of 2.1% for the decade before. India's CO2 emissions rose 0.6% last year, far slower than the prior decade when they grew about 3.4% per year, the report said.
CO2 emissions fell by 1% or more last year for several economically developed nations, including Germany, France, the UK and Japan, the report observed.
In raw numbers, China's CO2 emissions from energy totaled approximately 11.2 billion tonnes last year, far outstripping emissions from the U.S. (4.8 billion tonnes), India (3 billion tonnes) and Russia (1.6 billion tonnes). Global carbon emissions from energy last year reached roughly 35,806 million tonnes.
Coal
Coal use in the U.S. rose 10.4% last year to 8.7 EJ, reversing a decade-long trend where use of the "black rock" fell 5.6% per year. China, by contrast, used roughly 92.2 EJ of coal last year, roughly nine times more coal than the U.S. Its growth rate slowed to 0.3%, sharply slower than the 1.4% annual growth rate for the prior decade.At roughly 23 EJ, India's use of coal last year was roughly triple that of the U.S. India's growth rate for coal also slowed markedly, to 0.6% in 2025 down from 3.6% per year for the decade prior, the EI report said.
Globally, coal use rose 0.7% last year, an acceleration over the 0.5% annual growth over the prior decade. Coal use totaled roughly 166 EJ in 2025, the report said.
")
Crude Oil and Liquids
U.S. consumption of oil and liquids rose 0.7% in 2025, to an average of 20.6 million barrels per day (bpd), the EI report said. That growth rate was an uptick from the 0.5% annual average gain over the prior 10 years. Global liquids use was about 106.5 million bpd last year, with the U.S. accounting for approximately 19.3% of global oil use.China's liquids use averaged about 17.5 million bpd last year while India's use rose to about 5.8 million bpd, the report said. China's use amounted to about 16.4% of global liquids demand in 2025; India's usage was about 5.5%.
Natural Gas
Global natural gas consumption totaled about 405 billion cubic feet per day (Bcf/d) in 2025, a 1.6% gain over 2024 production. U.S. gas use last year averaged about 88.4 Bcf/d, EI said, about 22% of global use.On the production side, U.S. gas production averaged roughly 103.9 Bcf/d last year, a sharp 4/3% gain over 2025 production levels. Globally, about 406 Bcf/d of gas was produced last year, 1.6% more than in 2024. Other leading producers last year included Russia (59 Bcf/d), Iran (25.6 Bcf/d), Canada (20 Bcf/d), Qatar (17.8 Bcf/d) and Australia 14.4 Bcf/d).
Renewable Energy and Battery Storage
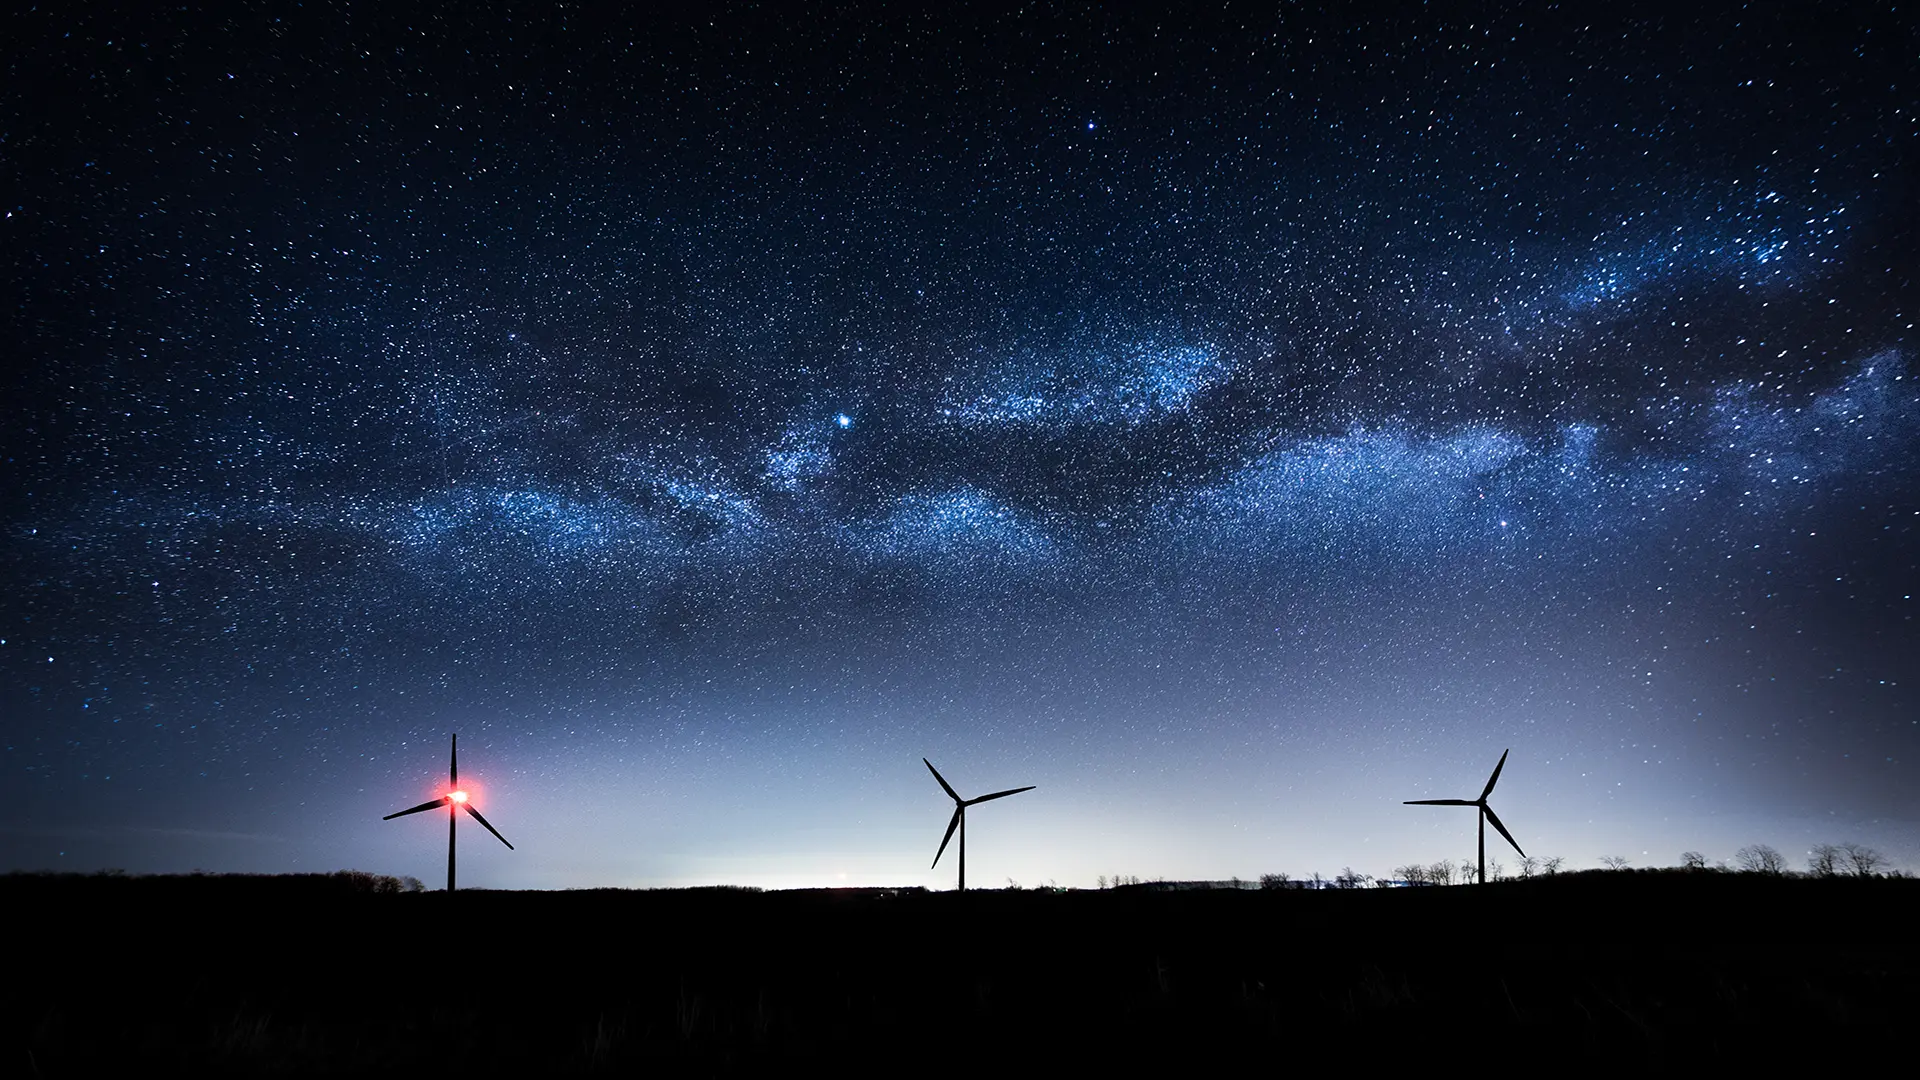
Although the U.S. energy system has diverged from many other economies, advanced as well as emerging, there was greater alignment around the world for renewable energy and battery energy-storage systems. Regarding solar energy, U.S. installed capacity rose 19.2% last year, tracking that of other nations, including Brazil (19.2% growth in 2025) and Germany (16.5%). But China and India experienced even stronger percentage gains of 35.5% and 37.6%, respectively, in 2025.Turning to wind energy, the EUI report said global installed capacity rose 14% last year to reach 1,291 GW. The U.S. accounted for 159 GW of that, more than India (54.5 GW) but less than China (641 GW).
In the U.S., EI said, the installed capacity of grid-scale battery energy-storage systems (BESS) grew approximately 63.3% last year, to about 56.6 GW. China's BESS capacity grew 81.2% last year, to approximately 144 GW, while Europe as a whole had about 58 GW of utility-scale BESS capacity at yearend 2025.
Key Takeaways
- The U.S. significantly diverged from most of the rest of the world last year when it came to energy supply and use.
- With its emphasis on "energy dominance," the Trump administration is cutting a different path on energy security compared to most of the rest of the world, which is emphasizing renewables and efficiency.
About Industrial Info Resources
Industrial Info Resources (IIR) is the leading provider of industrial market intelligence. Since 1983, IIR has provided comprehensive research, news and analysis on the industrial process, manufacturing and energy related industries. IIR's Global Market Intelligence (GMI) helps companies identify and pursue trends across multiple markets with access to real, qualified and validated plant and project opportunities. Across the world, Industrial Info Resources is tracking over 250,000 current and future projects worth $30.2 trillion (USD).
/iirenergy/industry-news/article.jsp
false
Want More IIR News Intelligence?
Make us a Preferred Source on Google to see more of us when you search.
Add Us On GoogleAsk Us
Have a question for our staff?
Submit a question and one of our experts will be happy to assist you.

Explore Our EnergyLive Tools
EnergyLive Tools provide instant insight into new build, outages, maintenance, and capacity shifts across key energy sectors.
Explore Our ToolsRelated Articles
-
GE Vernova Orders Up 88% Year-over-YearJuly 23, 2026
-
Europe Proposes Major Electrification PlanJuly 22, 2026

Explore Our Enery Industry Reports
Gain the competitive edge with IIR Energy’s suite of energy market reports, designed for traders, analysts, and asset managers who rely on verified, real-time data.
View ReportsIndustry Intel
-
European Chemicals and Transport Fuels OutlookPodcast Episode / Jul 10, 2026
-
2026 European Petroleum Refining Project OutlookPodcast Episode / Jun 26, 2026
-
Brazil: Efficiency, Innovation, and Opportunities in the Food & Beverage IndustryPodcast Episode / Jun 12, 2026
-
2026-2027 Investment Radar for Mexico, Central America & the CaribbeanPodcast Episode / May 29, 2026
-
Innovations Shaping the Next Era of Power GenerationPodcast Episode / May 22, 2026