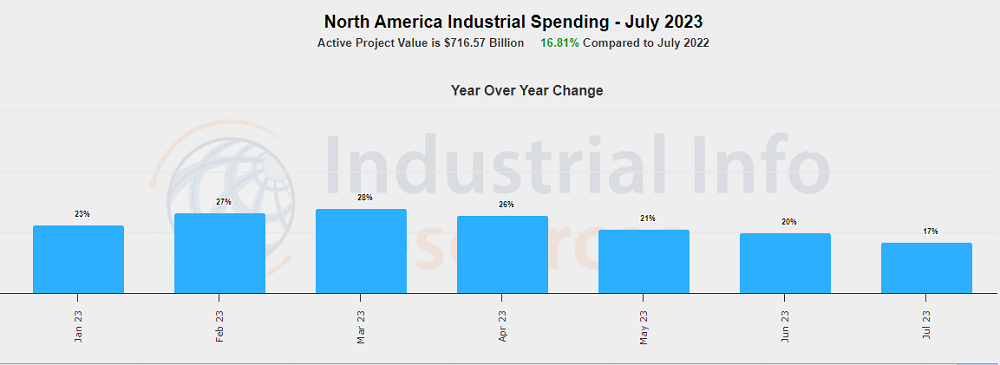
North American Industrial Project Spending Up Nearly 17% in July Year-over-Year
Industrial Info's most recent North American Industrial Project Spending Index shows active project spending in the U.S. in July increased 16.81% year-over-year, continuing a positive trend that began in January 2021. July marks the lowest year-over-year increase so far this year
The active project value for July was $716.57 billion. The Project Spending Index is a monthly indicator that compares active spending rates with the same month in the previous year to get a measure of growth or contraction in the industrial market. The index provides spending details by industry and market region.
For July, all but four of the 12 industries tracked by Industrial Info posted year-over-year increases in active project spending.
One of the largest gains in July was seen in the Power Industry, which recorded a $20.45 billion (15.34%) jump to $153.76 billion.
According to a recent report from the U.S. Energy Information Administration (EIA), developers added 16.8 gigawatts (GW) of utility-scale power generation in the U.S. in the first half of this year. However, about 8.2 GW of power generation was retired in the same period, mostly in the form of coal- and natural gas-fired plants.
Solar power, with 5.9 GW added to the grid from January through June, led the U.S. in the capacity of newly installed power, accounting for about 35% of U.S. power additions. Natural gas came just behind solar in newly added capacity, at 5.7 GW. For more information, see August 9, 2023, article - EIA: U.S. Installs 16.8 Gigawatts of Power in First Half of 2023.
Onshore Oil & Gas Production, including liquefied natural gas (LNG) projects, saw an 18.6% year-over-year increase to $88.9 billion in total investment value for July. On a global scale, LNG development is strong and growing, according to a recent Industrial Info webinar.
Industrial Info is tracking $57 billion of LNG liquefaction capacity set to be brought online in 2023-24, coming from 36 trains and accounting for 64 million tonnes per annum (MTPA). Industrial Info is tracking several LNG projects in the U.S. that are set to be brought online in this period, including the remaining six production modules, each with approximately 1.25 million metric tons per year of capacity, at Venture Global LNG's (Arlington, Virginia) Calcasieu Pass facility in Louisiana. Subscribers to Industrial Info's Production Project Database can click here for the project report. For more information, see August 17, 2023 article - IIR Webinar: Global LNG Development Strong and Growing.
Industrial Manufacturing saw an 11.62% year-over-year increase to $235.93 billion. U.S. manufacturing activity improved marginally in July when compared with June, according to a survey by the Institute for Supply Management (ISM), amid improvement in new orders. However, the reading for employment reached its lowest level in three years, indicating slower hiring and ongoing layoffs. For more information, see August 3, 2023, article - ISM: U.S. Manufacturing Activity Improves Slightly in July.
Construction Starts DownThe North American Construction Starts Index for July, meanwhile, was down 12% compared with July 2022. Construction starts spending for July totaled $260.11 billion. Spending was down in seven of the 12 industries tracked by Industrial Info.
According to the U.S. Federal Reserve's Beige Book of economic activity released in July, overall activity increased slightly since May, with five districts reporting growth, five reporting no change, and two reporting slight and modest declines. The Dallas, Texas-based reserve district reported modest expansion buoyed by gains in the service sector and single-family housing, but factory output, oil and gas drilling activity, and loan demand all declined.