Power
A Brief History of U.S. Power Industry Capital Spending 1993 - 2003
A total of 580 new power plants came online in the U.S., while 117 plants were closed during this period - Includes the U.S. Power Industry 10-Year Growth Chart
Released Wednesday, June 09, 2004
Researched by Industrialinfo.com (Industrial Information Resources, Incorporated; Houston, Texas). The data used to prepare this article was compiled over a ten-year period (1993-2003) by Industrialinfo.com's staff of power industry specialists through direct phone verification. The results reveal an accurate pattern of capital spending by the industry based on construction kick-off dates. During this timeframe, the U.S. power industry experienced an unparalleled increase in construction activity, which included capital and maintenance expenditures in excess of $213 billion. A total of 580 new power plants came online in the U.S., while 117 plants were closed during this period.
Prevalent themes throughout this period include increasing demand, increasing environmentally driven projects because of the Clean Air Act mandates, and an explosion in the construction of new natural gas fired power plants, which peaked in 2002 when in excess of 53,000 megawatts of new generating capacity came online.
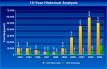 Click on the image at right to view a graphical representation of total megawatts coming online in the U.S. power industry from 1993 - 2003.
1993 ($15.26 billion) - During 1993, there was a good deal of capital spending directed toward the construction of new peaking units, expansion of existing generating plants, and cogeneration. Also, at this time owners were beginning to devote large capital outlays for Clean Air Act environmental compliance projects for the addition of continuous emissions monitoring systems (CEMS), low NOx burner installations (to meet early NOx Reduction Mandates), scrubber projects to reduce SO2 emissions, and electrostatic pecipitator projects to reduce particulate matter emissions. A new generation of control system upgrades were being installed. A fair amount of new electrical substations were being developed at this time to insure the reliability of the electrical systems.
1994 ($13.42 billion) - Environmental Spending continues into 1994 as more plants are required to install CEMS and low NOx burners, as well as some Scrubbers. Construction of grassroot peaking and cogeneration plants continue. Renewable energy projects emerge on the scene as development of windfarm projects, landfill gas to energy projects, geothermal, and hydro projects begin to take shape. Spending for maintenance projects also increases during this time from the previous year.
1995 ($14.86 billion) - Capital and maintenance spending increases from previous year due to major plant refurbishments, modernizations, and life extension projects. Construction of new generating units continues as well, as unit repowering projects. Spending for environmental compliance projects continues as plants continue to install low NOx burners. Maintenance Spending also remains steady during this period.
1996 ($16.9 billion) - Both the number of projects and total amount of spending increases during 1996. The majority of capital spending is directed towards plant upgrades and modernizations such as turbine refurbishments, boiler upgrades, coal yard improvements, control system replacements and other modernization projects. Environmental expenditures continue comply with NOx Reduction and SO2 reduction projects are implemented to comply with standards set forth by the Clean Air Act.
1997 ($11.37 billion) - The overall number of projects increases from the previous year, while total spending shows a significant decrease. This is due to a shift from major capital expenditures to maintenance programs and plant upgrades such as turbine refurbishments/replacements, boiler upgrades, control system replacement projects and minor environmental spending. In actuality, the lull in capital spending during this period is really the calm before the storm as a large number of new power plant construction projects reach the engineering phase.
1998 ($13.52 billion) - Spending begins to increase as construction begins on grassroot power plants scheduled to come online in 1999-2000. This is the beginning of a major rush to add new generation capacity, the majority of which is natural gas fired to meet increasing energy demands. Also during this period construction of renewable energy plants such as new windfarms in Texas, California, and other regions commence construction. Life extensions, maintenance spending, and environmental spending remains steady.
1999 ($21.94 billion) - Capital spending explodes as developers construct new merchant generating plants at an unprecedented pace to meet the nation's growing energy demand and the rush to compete in deregulated markets across the country. The Southwest, Southeast, West Coast, Mid West, Rocky Mountains and Great Lakes regions are all thriving areas of development for new generation.
2000 ($35.64 billion) - The California Energy Crisis of 1999-2000 creates a rush to build new power plants to supply energy to the California market. In other parts of the country such as the southwest, Southeast, and Great Lakes regions continue to be hotbeds for new construction activity. Fossil fuel fired plants, predominantly east of the Mississippi River, begin to install selective catalytic reduction units to further reduce NOx emissions.
2001 ($46.56 billion) - Construction kick-offs continue for grassroot power plants, unit additions at existing stations, and repowering projects for older less efficient generating units. To this point natural gas has been the fuel of choice for developers of new units, but with the tremendous amount of new plants coming online concerns are coming to the forefront over the available supply of natural gas. Also, during the last half of 2001 natural gas prices increase substantially. This leads some in the industry to begin uttering words not heard in a very long time-"coal-fired generation". Also, during this same timeframe construction is beginning to take off for renewable energy sources. These are primarily windfarms. Environmental compliance spending and maintenance spending continue to play a significant role in project spending.
2002 ($20.74 billion) - An economy already in decline is made worse by the terrorist attacks during September 11, 2001. During this time, the collapse of Enron and questionable business practices of others in the industry created a cloud of suspicion for potential investors. All of this coupled with declining power prices nationwide led to over half of the projects planned for construction kick-off in 2002 to be cancelled or delayed. Even some projects that had started construction are halted due to poor market conditions.
2003 ($18.50 billion) - Due to continuing poor market conditions and natural gas prices project delays continue. Overbuilding in some regions of the country leads to project cancellations. Construction kick-offs for new generation continues, but in almost all cases these are projects that have secured long term power purchase agreements, are peaking projects developed mostly by public utilities, or are units that are scheduled to replace capacity lost from older plants scheduled for retirement. Maintenance spending experiences healthy growth during this timeframe. Environmental compliance projects to reduce NOx, SO2 and Particulate emissions play a significant role in capital spending during 2003.
/news/article.jsp
false
Want More IIR News Intelligence?
Make us a Preferred Source on Google to see more of us when you search.
Add Us On GoogleAsk Us
Have a question for our staff?
Submit a question and one of our experts will be happy to assist you.
Forecasts & Analytical Solutions
Where global project and asset data meets advanced analytics for smarter market sizing and forecasting.
Explore Our SolutionsRelated Articles
-
Turkey Announces New Wind and Solar DriveJuly 24, 2026
-
Nuclear Resurgence Spurs Permitting, Supply Chain IssuesJuly 24, 2026
-
GE Vernova Orders Up 88% Year-over-YearJuly 23, 2026

PECWeb Global Market Intelligence Platform
Identify opportunities, anticipate change, and execute with confidence. PECWeb connects the industrial intelligence you need, from projects and assets to operational events, all in one platform.
Discover PecwebIndustry Intel
-
European Chemicals and Transport Fuels OutlookPodcast Episode / Jul 10, 2026
-
2026 European Petroleum Refining Project OutlookPodcast Episode / Jun 26, 2026
-
Brazil: Efficiency, Innovation, and Opportunities in the Food & Beverage IndustryPodcast Episode / Jun 12, 2026
-
2026-2027 Investment Radar for Mexico, Central America & the CaribbeanPodcast Episode / May 29, 2026
-
Innovations Shaping the Next Era of Power GenerationPodcast Episode / May 22, 2026