Power
Full Circle: After Lulls, U.S. LNG, Natural Gas-fired Power Projects Going Strong Again
After lulls in activity, U.S. LNG and natural gas-fired power project are going strong once again.
Released Wednesday, September 02, 2026
Reports related to this article:
Project(s): View 13 related projects in PECWeb
Plant(s): View 10 related plants in PECWeb
Written by Eric Funderburk for IIR News Intelligence (Sugar Land, Texas)
Summary
Comparing Industrial Info Resources' U.S. project coverage data between the 2016-20 and 2021-present periods shows the ups and downs of two major energy segments: liquefied natural gas (LNG) and power generation.A 10-Year Snapshot
Let your mind drift back in time to the heady days of 2016 through 2020. Former President Barack Obama was on his way out and President Donald Trump began his first term. Cheniere Energy opened the period by shipping the very first U.S. commercial liquefied natural gas (LNG) cargo, and toward the end of the period, a global pandemic began. In the power sector, the 2016-2020 period saw the escalating rise of solar and wind power projects and a decline in natural gas power construction.Fast-forward to next five-plus years from 2021 to the present day, and consider what's occurred: The entire Biden presidency has taken place, followed by some sharp about-face federal policy shifts in Trump's second term. The last five years have seen the coming and killing of a U.S. offshore wind revolution, the penetration of hyperscale data centers into multiple locations requiring tremendous new inputs of baseload power, and has brought firmly into position as the world's leading LNG exporter.
A look at Industrial Info Resources data over the 10-year-plus period show that while some things remain similar, others have changed. From 2016 through the end of August 2026, Industrial Info Resources tracked 48,226 U.S. industrial capital projects that kicked off, valued at $3.39 trillion, including $644 billion worth of power projects and $139 billion worth of new U.S. LNG projects.
U.S. LNG Sector...Then & Now
So what exactly were some of the larger industrial trends taking shape in the U.S. from 2016 through 2020? As mentioned, Cheniere Energy shipped the first commercial cargo of LNG. A significant wave of U.S. LNG spending had already commenced by this time, although the period did see the start of ExxonMobil and QatarEnergy's Golden Pass LNG terminal in Texas and Venture Global LNG's Calcasieu Pass plant in Louisiana. Work on new trains commenced at Cheniere's Sabine Pass and Corpus Christi facilities, and Kinder Morgan-led Southern LNG's Elba Island facility near Savanah, Georgia, transitioned from an import facility to a bidirectional terminal capable of producing around 2.5 million tons per annum (MTPA) of LNG. While around $16.3 billion worth of U.S. LNG projects commenced over this period (which also includes some peak-shave power projects and storage tanks), a larger $57.2 billion worth of projects were completed during these five years, showing the first wave of U.S. LNG construction was well underway by 2016.Fast-forward to 2021-26 and one finds an overall acceleration in the sector, with more than $123.7 billion worth of U.S. LNG-related projects kicking off during the period, virtually all of which is still under construction, with a flood of LNG project permitting coming during the second Trump administration following a one-year permitting pause for new plants in the final year of Joe Biden's presidency. President Donald Trump lifted the order pausing permits on the first day of his second term via an executive order.
After flirting with obtaining the top position in 2022, the U.S. firmly secured its place as the world's top LNG exporter in 2023, a position that seems set to stay for a while as 2025's No. 2 exporter, Qatar, has suffered extensive damage to its massive Ras Laffan North and Ras Laffan South complexes, forcing QatarEnergy to repeatedly declare force majeure on LNG cargos. Australia and Qatar were in a very close competition for second position last year, far behind the U.S., and the U.S. Energy Information Administration in mid-July reported that Qatari exports have fallen significantly this year, with closures of the Strait of Hormuz cutting off approximately 20% of global LNG supplies. With more than a dozen LNG trains under construction along the U.S. Gulf Coast, the country's top position seems secure for some time.
From 2021 to the present, LNG companies at work in the 2016-2020 period have continued expanding their presence in the U.S., with Venture Global now at work on its CP2 plant next to the original Calcasieu Pass plant. Sempra Energy is constructing four trains in Port Arthur, Texas, expected to bring about 26 MTPA online, while NextDecade is expected to be at work on all five trains of its Rio Grande plant in Brownsville, Texas, by the end of this year. Cheniere has continued to expand its Sabine Pass plant and has grown its Texas presence further with its Corpus Christi Stage III project. Commonwealth LNG, whose entire six-train plant in Louisiana received U.S. Federal Energy Regulatory Commission (FERC) authorization in 2022, kicked off construction on its Cameron Parish plant in 2026, after receiving an extension on the completion date from FERC in 2025.
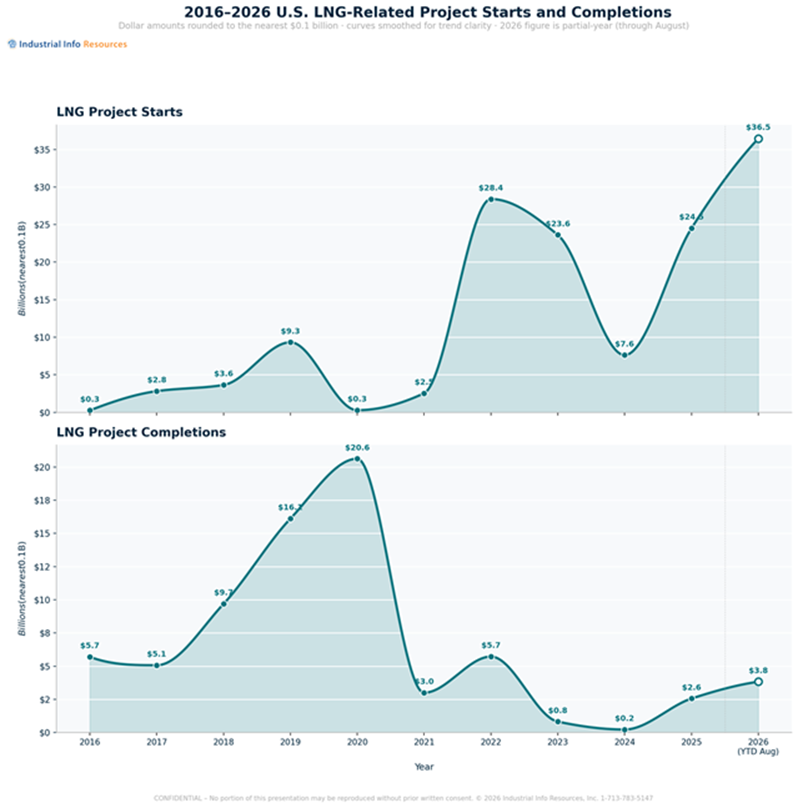
There were notable dips in LNG project starts at the start of the COVID-19 pandemic and in the final year of the Biden administration, when a pause on new LNG permitting was in place.
In summary, active LNG construction has been strong during both periods, although this has come in distinct waves rather than as continued incremental project additions. Showing the wavelike ebbs and flows of construction, while more than $120 billion of U.S. LNG-related projects are presently under construction, relatively few major completions have been recorded since 2021, adding up to around $16 billion worth of finished projects, primarily from the likes of Venture Global's Calcasieu Pass plant, the first train of Golden Pass (finished earlier this year), and two additional trains at Cheniere's Corpus Christi and Sabine Pass plants.
The Power Sector
The U.S. Power Industry cemented its transition into renewables during the 2016-2020 period, although a construction wave of natural gas-fired projects was running strong at the start of the period, only to give way by the end of the period to a significant number of wind and solar power projects. After a lull in U.S. natural gas-fired power that was dominated by renewables, natural gas-fired projects are coming back to a front-and-center position in the U.S., as utilities seek to increase available baseload capacity from an onslaught of large-load data center projects and data center developers themselves build their own behind-the-meter gas-fired power.In the 2016-2020 period, Industrial Info Resources data indicate about $247 billion worth of capital power projects kicked off in the U.S., with wind very much in the lead for the period, accounting for more than $92 billion worth of projects starts, followed by $49.6 billion from solar and $43.7 billion from natural gas. However, a breakdown by year shows gas actually leading U.S. project starts by value in 2016 (although barely), chiming in with nearly $14 billion worth of project starts versus wind's $13.5 billion. However, during this five-year period, gas projects would wane and solar would increase its role in the U.S. power mix. By 2020, wind and solar were neck and neck in the value of project starts with more than $17 billion worth each, while natural gas projects ran at a distant third place, coming in with $4.8 billion worth of starts.
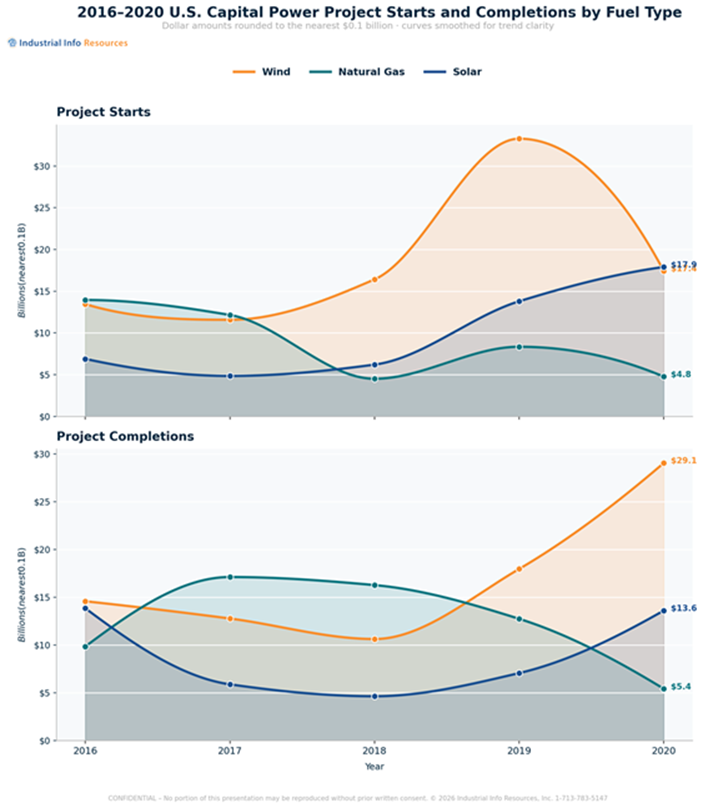
Wind power was the clear leader for project starts in the 2016-2020 period, although toward the end, solar was gaining was heading toward its dominant position, which it has held from 2021 on.
Shift to 2021 to the present day, and Industrial Info Resources data indicate $398 billion of project starts, with solar projects easily garnering the most investment with more than $165.4 billion worth of project starts, followed by $68.7 billion for wind, and natural gas at a very distant third at a little more than $42 billion worth of U.S. project starts for the five-year-plus period, although 2026 has brought a dramatic uptick in natural gas project starts that seems to set to stay for the foreseeable future.
Other notable shifts occurring during the five-year period include the coming and going of a relatively strong U.S. offshore wind industry, which was virtually nonexistent before 2021. Former President Biden put in place the lofty goal of having 30 gigawatts of U.S. offshore wind built by 2030. While this goal was met with some skepticism, it helped launch a spending wave for offshore wind projects, led by European companies such as Ørsted and Equinor as well as a large project from Virginia-based Dominion Energy. However, the second Trump has effectively torpedoed Biden's goal, putting it realistically out of reach through a series of policies antagonistic toward the sector and the buyout of existing wind leases, which has now reached billions of dollars. The transition toward solar's dominance in U.S. power construction took a drastic leap in 2021, with solar leading the pack with more than $28.8 billion worth of construction starts that year, a leading position it maintains through the present. Wind came in a distant second position in 2021 with $12.3 billion worth of project starts. Project completions from that year show the tail-end of a still-dominant wind sector, which saw nearly $18 billion worth of projects completed in 2021, versus the up-and-coming solar's $15.9 billion worth.
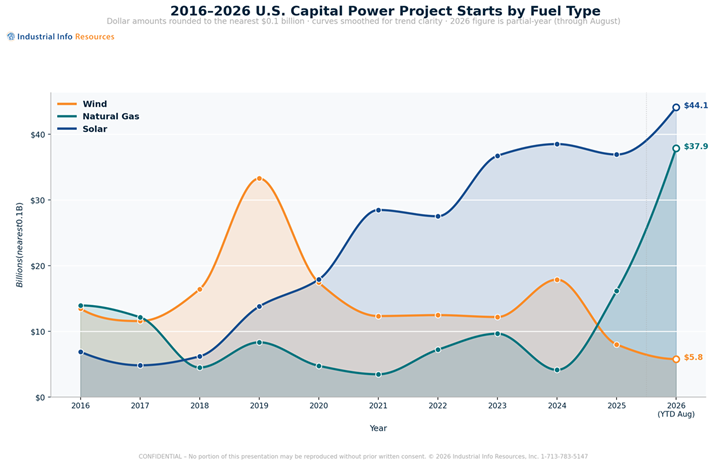
A view of U.S. power project starts by fuel type from 2016 to present.
Shift to 2025, and solar very much led project starts, but natural gas moved into second position over wind with $16 billion of new U.S. projects, followed by wind with $8 billion worth. Natural gas gained prominence over wind in 2025, and has seen absolutely explosive growth in 2026, marking the start of a new cycle of natural gas-fired buildout. Industrial Info Resources data indicate that for the first eight months of 2026 alone, $37.9 billion worth of natural gas-fired power projects have kicked off, already nearly the full-year 2025 investment for solar.
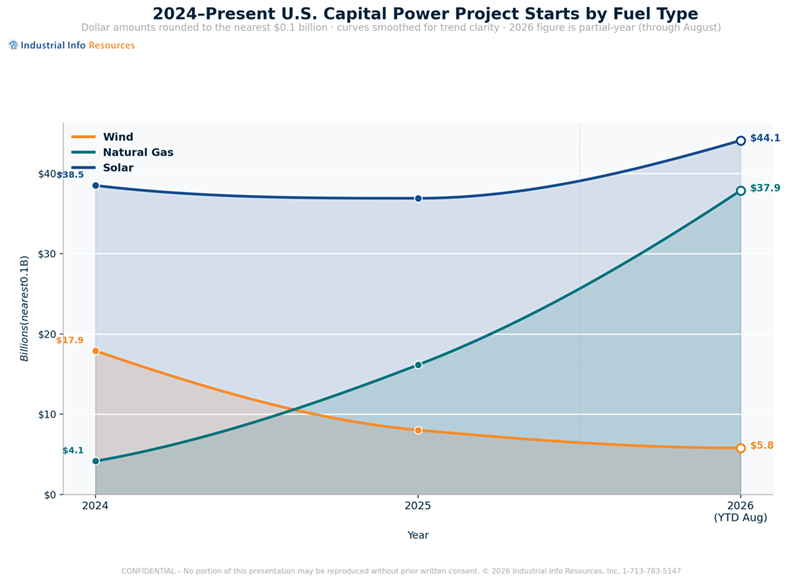
Zooming in on U.S. power project starts from 2024 shows natural gas construction surpassing wind in 2025 and escalating rapidly in 2026.
The Present View
Somehow, somewhere in all of this is the lesson that the more things change, the more they stay the same. The past 10 years have seen ebbs and flows in U.S. LNG construction and the types of power generation projects kicking off. The second Trump administration has in many ways brought the U.S. LNG and power sectors full circle, paving the way for a wave of new LNG projects and seeing natural gas-fired power projects accelerate rapidly after losing steam over the past 10 years.Key Takeaways
- After a slowdown in previous years, U.S. LNG and natural gas-fired construction activity has escalated under the second Trump administration.
- In 2026, natural gas surpassed wind in the value of U.S. power project starts.
- U.S. LNG spending was unleashed after President Trump lifted a Biden-era pause on permitting for new LNG plants.
About Industrial Info Resources
Industrial Info Resources (IIR) is the leading provider of industrial market intelligence. Since 1983, IIR has provided comprehensive research, news and analysis on the industrial process, manufacturing and energy related industries. IIR's Global Market Intelligence (GMI) helps companies identify and pursue trends across multiple markets with access to real, qualified and validated plant and project opportunities. Across the world, Industrial Info Resources is tracking over 250,000 current and future projects worth $30.2 trillion (USD).
/news/article.jsp
false
Want More IIR News Intelligence?
Make us a Preferred Source on Google to see more of us when you search.
Add Us On GoogleAsk Us
Have a question for our staff?
Submit a question and one of our experts will be happy to assist you.

Forecasts & Analytical Solutions
Where global project and asset data meets advanced analytics for smarter market sizing and forecasting.
Explore Our SolutionsRelated Articles
-
Shell Expecting Dip in LNG VolumesOctober 08, 2026
-
Louisiana Gets Hot with LNG Offtake DealsOctober 06, 2026
-
LNG Supports U.S. Energy Dominance, Army Corps SaysOctober 01, 2026
-
LNG from Qatar to Europe Delayed to DecemberSeptember 30, 2026
-
QatarEnergy Acknowledges Gas-Delivery IssuesSeptember 22, 2026

PECWeb Global Market Intelligence Platform
Identify opportunities, anticipate change, and execute with confidence. PECWeb connects the industrial intelligence you need, from projects and assets to operational events, all in one platform.
Discover PecwebIndustry Intel
-
Latin America Data Center Outlook 2026: Power, Hubs & GrowthPodcast Episode / Oct 9, 2026
-
Food and Beverage CapEx Outlook 2026: Tariffs, AI, AfricaPodcast Episode / Oct 9, 2026
-
North America Refining 2026: New Pipelines to PADD 5Podcast Episode / Oct 2, 2026
-
Biomanufacturing Onshoring 2026: GLP-1, CDMO and ReshoringPodcast Episode / Oct 2, 2026
-
2026 US Data Center Outlook: Power, Land & CoolingPodcast Episode / Sep 18, 2026