Metals & Minerals
Gold Looks for $450/oz in 2004 as 2003 Production Hit 2,593 Tons with Standout Turkish Demand
The two regions reported a combined output decline of about 40 tons compared to 2002. Offsetting the losses in these mature gold mining areas, a handful of new mines, coupled with a modest...
Released Friday, April 23, 2004
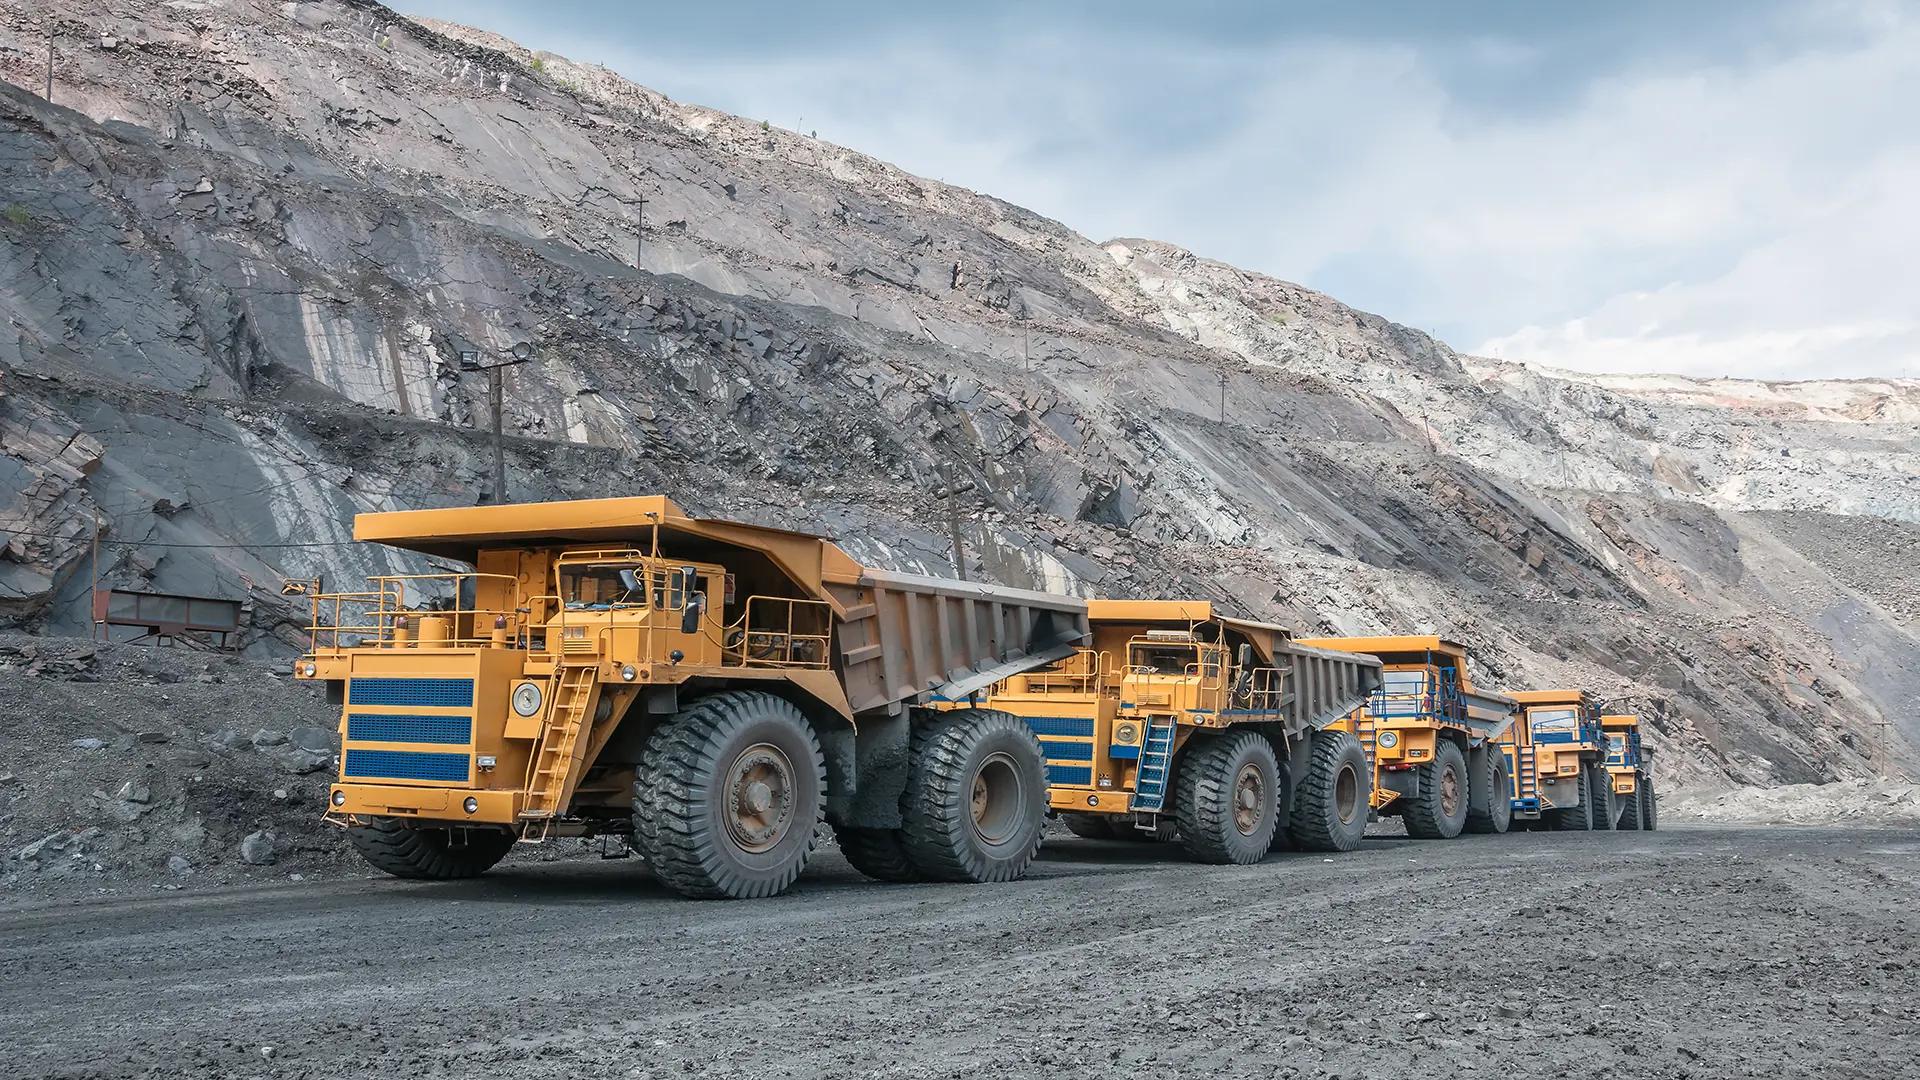
Researched by Industrialinfo.com (Industrial Information Resources, Incorporated; Houston, Texas). Mine closures, lower grades, and operational difficulties adversely impacted gold production in North America and South Africa in 2003, the GFMS Gold Survey 2004 reported at mid-April presentations in London, Toronto, and Johannesburg.
The two regions reported a combined output decline of about 40 tons compared to 2002. Offsetting the losses in these mature gold mining areas, a handful of new mines, coupled with a modest boost in production from the informal sector left total global production a fraction higher at 2,593 tons.
Both North America and South Africa registered a 5% drop compared to 2002. About 66% of the North American decline was attributable to losses in the U.S., where output was cut back by nearly fourteen tons to total 285 tons. This is the lowest level of U.S. gold production since 1989. The drop in South Africa was largely a result of operational difficulties, lower grades, and the effects of a strengthening Rand currency, which resulted in the suspension of mining activities at marginal production areas in the second half of the year.
Gains in production were seen in Australia, where a handful of new mines that had commenced operations in the final quarter of 2002, added roughly twelve tons to the production total and accounted for a major part of the 7% increase in the country's production.
Mine start-ups in Saudi Arabia and Laos added a combined ten tons to the 2003 total. Significant growth was also seen in China (6%), Peru ((%), and Tanzania (16%). Higher grades at Peru's giant Yanacocha mine were largely responsible for that country's gains, while in Tanzania a full year's contribution from the new North Mara mine combined with higher grades at Geita partly accounted for the increase.
All the major producing regions reported higher cash costs in 2003, with the global total up 23% year-on-year at $222/oz. The $42/oz rise was primarily due to currency effects, although higher global energy charges and higher royalties and production taxes (which are linked to the price of gold) also contributed to last year's significant cost inflation.
The global total of 2,593 tons was up three tons on the 2002 figure, but fell just short of the record 2,621 tons reported by GFMS in 2001. Official sector sales continued their recent growth path with an 11% increase to 606 tons, a level last surpassed in 1992. The price rally, especially in the second half of 2003, was factor behind this rise, most of which came from outside Europe. Further falls in the leasing rates were the main reason for the 315-ton cut in estimated official lending.
Scrap supply in 2003 rose by almost 13% to a five-year high of 943 tons. This increase (making scrap almost 23% of total supply was mainly due to large gains in India and East Asia that stemmed chiefly from the price rally.
Total fabrication fell 4% to 3,049 tons in 2003, largely due to the 6% drop in jewelry demand. Other industrial and decorative demand also saw a modest fall of 2% and dental offtake slipped by a fraction. In contrast electronics consumption was up 14% and coin fabrication rose by nine tons. The prime causes for the slip in jewellery were the Iraq war, SARS, the gold rally, pockets of slack economic growth and the secular shift from plain gold to other forms of jewellery. Gold in jewellery fell to a 12-year low offtake of 2,533 tons. Small gains were seen in the most important jewellery markets of China and India.
De-hedging fell 29% to 310 tons, although, this was still the second highest level ever. The decline was largely a result of a positive price outlook, shareholder pressure, and buy backs of positions inherited through merger activity. Fresh project hedging partly offset the drop. Four gold producers generated about 70% of the reduction in the global hedge book. Newmont (NYSE:NEM, TO:NMC) (Toronto, Ontario) accounted for 26%, Barrick 18% (NYSE, TO: ABX), Anglogold 16% (NYSE:AU, JSE:ANG) (Johannesburg, South Africa) and Placer Dome 11% (NYSE, TO:PDG) (Vancouver, British Columbia).
Trends for gold demand in the Middle East look good for 2004 as it broadens to encompass jewellery as well as gold bars and coins. Countries where demand fell in 2003 may recover this year. Gold demand in the Middle East rose 9% in 2003 to 631 tons. This was in the main driven by an amazing increase of 47% in Turkish demand (84 tons) to reach 260 tons. If Turkish consumption were taken out of the total the region's offtake would have been seen to fall by 7%.
GFMS forecast that the future gold prices have a strong bias to the upside, seeing $450 as a good possibility (gold price April 21, 2004 - $392/oz) should the conditions remain right for attracting further investor interest. The UK based consultancy believes that perhaps the greatest driver of investment over the next year or so will be economic developments in the US.
/news/article.jsp
false
Want More IIR News Intelligence?
Make us a Preferred Source on Google to see more of us when you search.
Add Us On GoogleAsk Us
Have a question for our staff?
Submit a question and one of our experts will be happy to assist you.

Forecasts & Analytical Solutions
Where global project and asset data meets advanced analytics for smarter market sizing and forecasting.
Explore Our SolutionsRelated Articles
-
Isaias Forecast to Become First Hurricane of 2026 as Gulf En...October 07, 2026
-
KGHM, South32 Advance Sierra Gorda Copper Mine Expansion as ...October 07, 2026
-
Cornwall Lithium to Boost U.K. Critical Minerals PushOctober 07, 2026
-
KGHM y South32 avanzan en la expansión de la mina de cobre S...October 07, 2026

PECWeb Global Market Intelligence Platform
Identify opportunities, anticipate change, and execute with confidence. PECWeb connects the industrial intelligence you need, from projects and assets to operational events, all in one platform.
Discover PecwebIndustry Intel
-
North America Refining 2026: New Pipelines to PADD 5Podcast Episode / Oct 2, 2026
-
Biomanufacturing Onshoring 2026: GLP-1 Drives CapexPodcast Episode / Oct 2, 2026
-
2026 US Data Center Outlook: Power, Land & CoolingPodcast Episode / Sep 18, 2026
-
2026 Global Power Demand Outlook: Gas, Nuclear & RenewablesPodcast Episode / Sep 18, 2026
-
2026 Oil & Gas CapEx Outlook: Middle East, LNG & PermianPodcast Episode / Sep 4, 2026