Power
2004 U.S. Power Industry Outlook Update
Currently, Industrialinfo.com is tracking 289 power plant capital and maintenance projects representing $31.4 billion that either have already started construction this year, or are on track to start construction this year - Includes the 2004 Forecasted Versus Adjusted U.S. Power Industry Capital Spending Chart and 2004 Power Industry Project Fallout Pie Chart
Released Thursday, June 10, 2004

Researched by Industrialinfo.com (Industrial Information Resources, Incorporated; Houston, Texas). On the down slope of a ten year period of unprecedented growth for power plant construction and capital spending (see June 9, 2004 industry article: A Brief History of U.S. Power Industry Capital Spending 1993 - 2003), many in the industry are asking the question - "How far will the industry fall?" The answer - "Not far at all" - may come as a surprise to some analysts spouting gloom and doom for the industry, but Industrialinfo.com is forecasting a strong 2004 due to present capital spending trend indicators. While not close to the $46 billion spent during the peak of the power plant construction boom in 2001, Industrialinfo.com is tracking approximately $31.4 billion in capital spending, which has already kicked off or is scheduled to kick-off in 2004.
This current spending projection is a downgrade from our initial December 2003 forecast of $92.6 billion due to a continual monitoring and re-evaluation of feedback from project developers. In December 2003, Industrialinfo.com had identified an active base of 479 projects that were scheduled for kick-off in 2004. After reverification of the data 190 projects representing $61.2 billion had fallen out of the initial 2004 capital spending forecast due to cancellations and delays. Over capacity as a result of the boom construction period during the past four years and increasing fuel costs have caused numerous project cancellations, and delays in the power industry.
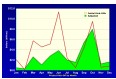 Click on the image at right to view the 2004 Forecasted Versus Adjusted U.S. Power Industry Capital Spending Chart.
2004 Adjusted Forecast Results:
*Active Projects: (289) Projects representing $31.4 billion
*Cancellations: (100) Projects representing $30.3 billion
*On-Hold: (26) Projects or $7.3 billion
*Delayed: (64) projects or $23.6 billion
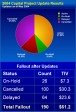 Click on the image at right to veiw the 2004 Power Industry Project Fallout Pie Chart.
Capital spending in the Power industry was flat in the beginning of the year due to a continuation of project cancellations and delays. A high level of maintenance activity that occurred at the end of the first quarter suggests that capital spending could have been postponed for maintenance activity. Overall spending continues to follow this trend through the remaining second quarter period and well into the third quarter. Most of the projects that are kicking off construction during this time are driven by plant upgrades and some environmental compliance programs. There are some new generating projects that are starting construction during this time but most are small peaking projects scheduled to come online before the summer of 2005.
The significant upswing in project activity construction kick-off's that are still on target to begin this fall of 2004 signifies projects that have been delayed for construction starts during this time. Many of these are projects that if built would add new generation. At the same time many of these projects are permitted and are now in the process of trying to obtain power purchase agreements and or capital approval. This figure could drop significantly if power markets do not improve prior to the third quarter. Also this is an excellent time of the year to perform maintenance outage work after the summer season. Maintenance projects will account for a significant portion of overall spending during the third and fourth quarter. The end of the year experiences another significant drop in spending. This is due to the fact that maintenance projects are winding down and in many regions construction schedule of major construction or capital projects are delayed due to weather concerns.
For more information on the 298 active power projects scheduled to kick-off this year contact Industrialinfo.com's Member Center at 1-800-762-3361.
Want More IIR News Intelligence?
Make us a Preferred Source on Google to see more of us when you search.
Add Us On GoogleAsk Us
Have a question for our staff?
Submit a question and one of our experts will be happy to assist you.

Forecasts & Analytical Solutions
Where global project and asset data meets advanced analytics for smarter market sizing and forecasting.
Explore Our SolutionsRelated Articles
-
Turkey Announces New Wind and Solar DriveJuly 24, 2026
-
Nuclear Resurgence Spurs Permitting, Supply Chain IssuesJuly 24, 2026
-
GE Vernova Orders Up 88% Year-over-YearJuly 23, 2026

PECWeb Global Market Intelligence Platform
Identify opportunities, anticipate change, and execute with confidence. PECWeb connects the industrial intelligence you need, from projects and assets to operational events, all in one platform.
Discover PecwebIndustry Intel
-
European Chemicals and Transport Fuels OutlookPodcast Episode / Jul 10, 2026
-
2026 European Petroleum Refining Project OutlookPodcast Episode / Jun 26, 2026
-
Brazil: Efficiency, Innovation, and Opportunities in the Food & Beverage IndustryPodcast Episode / Jun 12, 2026
-
2026-2027 Investment Radar for Mexico, Central America & the CaribbeanPodcast Episode / May 29, 2026
-
Innovations Shaping the Next Era of Power GenerationPodcast Episode / May 22, 2026