Power
Clean Energy Limited Growth of Energy-Related CO2 Emissions in 2023
The growing proliferation of non-emitting sources of energy, such as solar and wind, as well as the growing popularity of electric vehicles (EVs), helped keep 2023's CO2 emissions gain lower than those of 2022
Released Tuesday, March 05, 2024
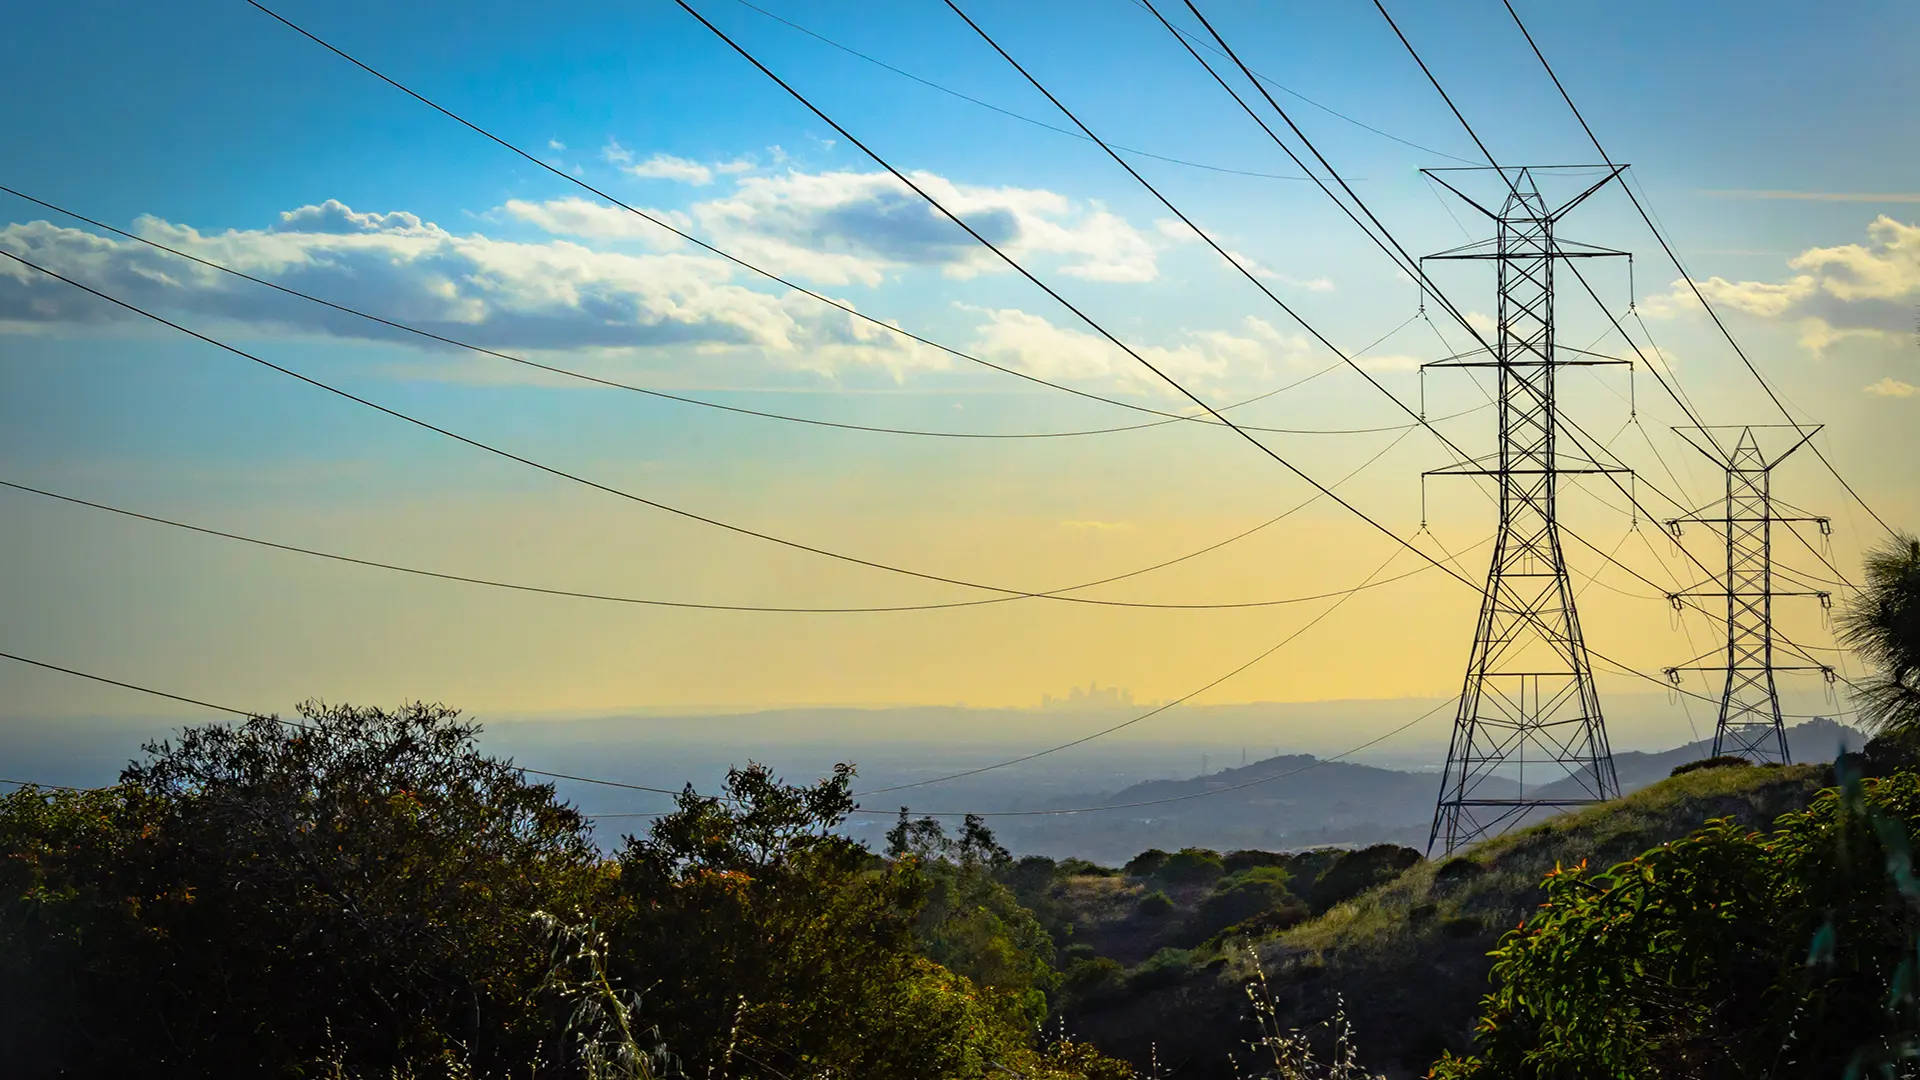
Written by John Egan for Industrial Info Resources (Sugar Land, Texas)--Worldwide carbon dioxide (CO2) emissions from the energy sector rose about 1.1% in 2023, or about 410 million tonnes (MT), to a total of about 37.4 billion tonnes, the International Energy Agency (IEA) (Paris, France) reported in a March 1 publication, CO2 emissions in 2023. Coal accounted for an estimated 65% of 2023's CO2 emissions increase.
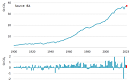 Click on the image at right to see annual global CO2 emissions since 1900.
Last year's CO2 emission increase, smaller than 2022's gain of about 490 MT, stemmed in part from "exceptional droughts" that cut into hydropower production, forcing countries to rely on other means--typically fossil fuels--of generating electricity. But the growing proliferation of non-emitting sources of energy, such as solar and wind, as well as the growing popularity of electric vehicles (EVs), helped keep 2023's emissions gain lower than 2022's, the report said.
Without "clean" energy technologies, including nuclear power, the agency said the global increase in CO2 emissions in the last five years would have been three times larger. The world's total demand for energy grew in 2023 compared to 2022, it added.
Extreme droughts in China, the U.S. and other countries in 2023 led to increased use of fossil fuels to generate electricity, the IEA said. Had it not been for the unusually low hydropower output, global CO2 emissions from electricity generation would have declined last year, it added.
Looking back over the five-year period, 2019-2023, the report said CO2 emissions increased from non-clean technology faster than clean energy technologies could lower them, leading to the overall gain. Without the growing deployment of five key clean energy technologies since 2019--solar PV, wind, nuclear, heat pumps and electric vehicles--the IEA projected that global emissions growth would have been three times larger than it was for that five-year period.
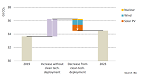 Click on the image at right to see the forces that pushed global emissions of CO2 upward and downward over the 2019-2023 period.
"The clean energy transition has undergone a series of stress tests in the last five years--and it has demonstrated its resilience," IEA Executive Director Fatih Birol said in a statement accompanying the release of the CO2 emissions report. "A pandemic, an energy crisis and geopolitical instability all had the potential to derail efforts to build cleaner and more secure energy systems. Instead, we've seen the opposite in many economies."
"The clean energy transition is continuing apace and reining in emissions--even with global energy demand growing more strongly in 2023 than in 2022," he continued. "The commitments made by nearly 200 countries at COP28 in Dubai in December show what the world needs to do to put emissions on a downward trajectory. Most importantly, we need far greater efforts to enable emerging and developing economies to ramp up clean energy investment."
CO2 Emissions in 2023 noted that advanced economies' gross domestic product (GDP) grew an average 1.7% last year, while emissions fell 4.5%, which was a record decline for a non-recessionary year. Emissions from advanced economies fell about 520 MT last year, making their 2023 emissions of CO2 the same as it was in 1973. Demand for coal in advanced economies is back to where it was in the year 1900. The 2023 decline in advanced economy emissions was caused by "a combination of structural and cyclical factors, including strong renewables deployment and coal-to-gas switching in the U.S., but also weaker industrial production in some countries, and milder weather."
On the other side of the carbon ledger, emissions in China grew about 565 MT last year, by far the largest increase of any country globally and a continuation of China's emissions-intensive economic growth in the post-pandemic period. However, China also continued to dominate global clean energy additions. Cyclical effects--notably, a historically bad hydro year--contributed about one-third of its emissions growth in 2023. Per capita emissions in China are now 15% higher than in advanced economies.
India experienced strong economic growth in 2023, which drove emissions by about 190 MT. That growth was accompanied by a weak monsoon season which cut hydropower production and further increased emissions, the report said.
The report details how multiple droughts cut into hydropower in 2023. Worldwide hydroelectric output fell about 4%, or about 200 terawatt-hours, last year, the report estimated. But the effect was felt differently across countries: China's hydropower output fell about 10% in 2023. North American hydro fell about 9%, while India's hydro production plummeted about 15%. Hydropower output fell about 12% in Southeast Asia, but it rose about 11% in Europe.
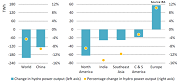 Click on the image at right to see how droughts around the world affected hydropower production in 2023.
On a year-over-year basis, energy-related CO2 emissions declined last year in the U.S., the world's largest economy, as increases stemming from GDP growth were more than offset by milder temperatures, coal-to-gas switching, renewable energy and other factors. Overall energy-related emission fell to about 1,300 MT from about 1,550 MT in 2022.
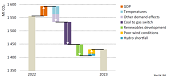 Click on the image at right to see the forces affecting U.S. CO2 emissions from 2022 to 2023.
It was a very different story in China last year, as economic growth, the hydro shortfall and the post-COVID reopening of the economy combined to push CO2 emissions upward to about 12,720 MT, from about 12,150 MT in 2022.
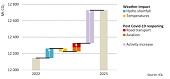 Click on the image at right to see the forces affecting China's CO2 emissions from 2022 to 2023.
A companion report accompanying the CO2 emissions report showed dramatic worldwide growth in deployment of clean technologies from 2022 to 2023. According to the IEA's inaugural Clean Energy Market Monitor, also released March 1, solar PV deployments skyrocketed 85% in 2023 compared to 2022, wind shot up 60%, and electric vehicles grew 35%. Electrolyzers, which are needed to create hydrogen, rose 360%, albeit from a small base. Deployment of nuclear power, however, fell 30%, while heat pumps fell about 3%.
Industrial Info Resources (IIR) is the leading provider of industrial market intelligence. Since 1983, IIR has provided comprehensive research, news and analysis on the industrial process, manufacturing and energy related industries. IIR's Global Market Intelligence (GMI) platform helps companies identify and pursue trends across multiple markets with access to real, qualified and validated plant and project opportunities. Across the world, IIR is tracking more than 200,000 current and future projects worth $17.8 trillion (USD).
/news/article.jsp
false
Want More IIR News Intelligence?
Make us a Preferred Source on Google to see more of us when you search.
Add Us On GoogleAsk Us
Have a question for our staff?
Submit a question and one of our experts will be happy to assist you.

Forecasts & Analytical Solutions
Where global project and asset data meets advanced analytics for smarter market sizing and forecasting.
Explore Our Solutions
Industrial Project Opportunity Database and Project Leads
Get access to verified capital and maintenance project leads to power your growth.
Discover Our DatabaseIndustry Intel
-
2026-2027 Investment Radar for Mexico, Central America & the CaribbeanPodcast Episode / May 29, 2026
-
Innovations Shaping the Next Era of Power GenerationPodcast Episode / May 22, 2026
-
The Role of Contract Manufacturing in Global Pharma GrowthPodcast Episode / May 8, 2026
-
2026 North American Labor OutlookPodcast Episode / Apr 24, 2026
-
2026 European Metals & Minerals Project Spending OutlookPodcast Episode / Apr 7, 2026