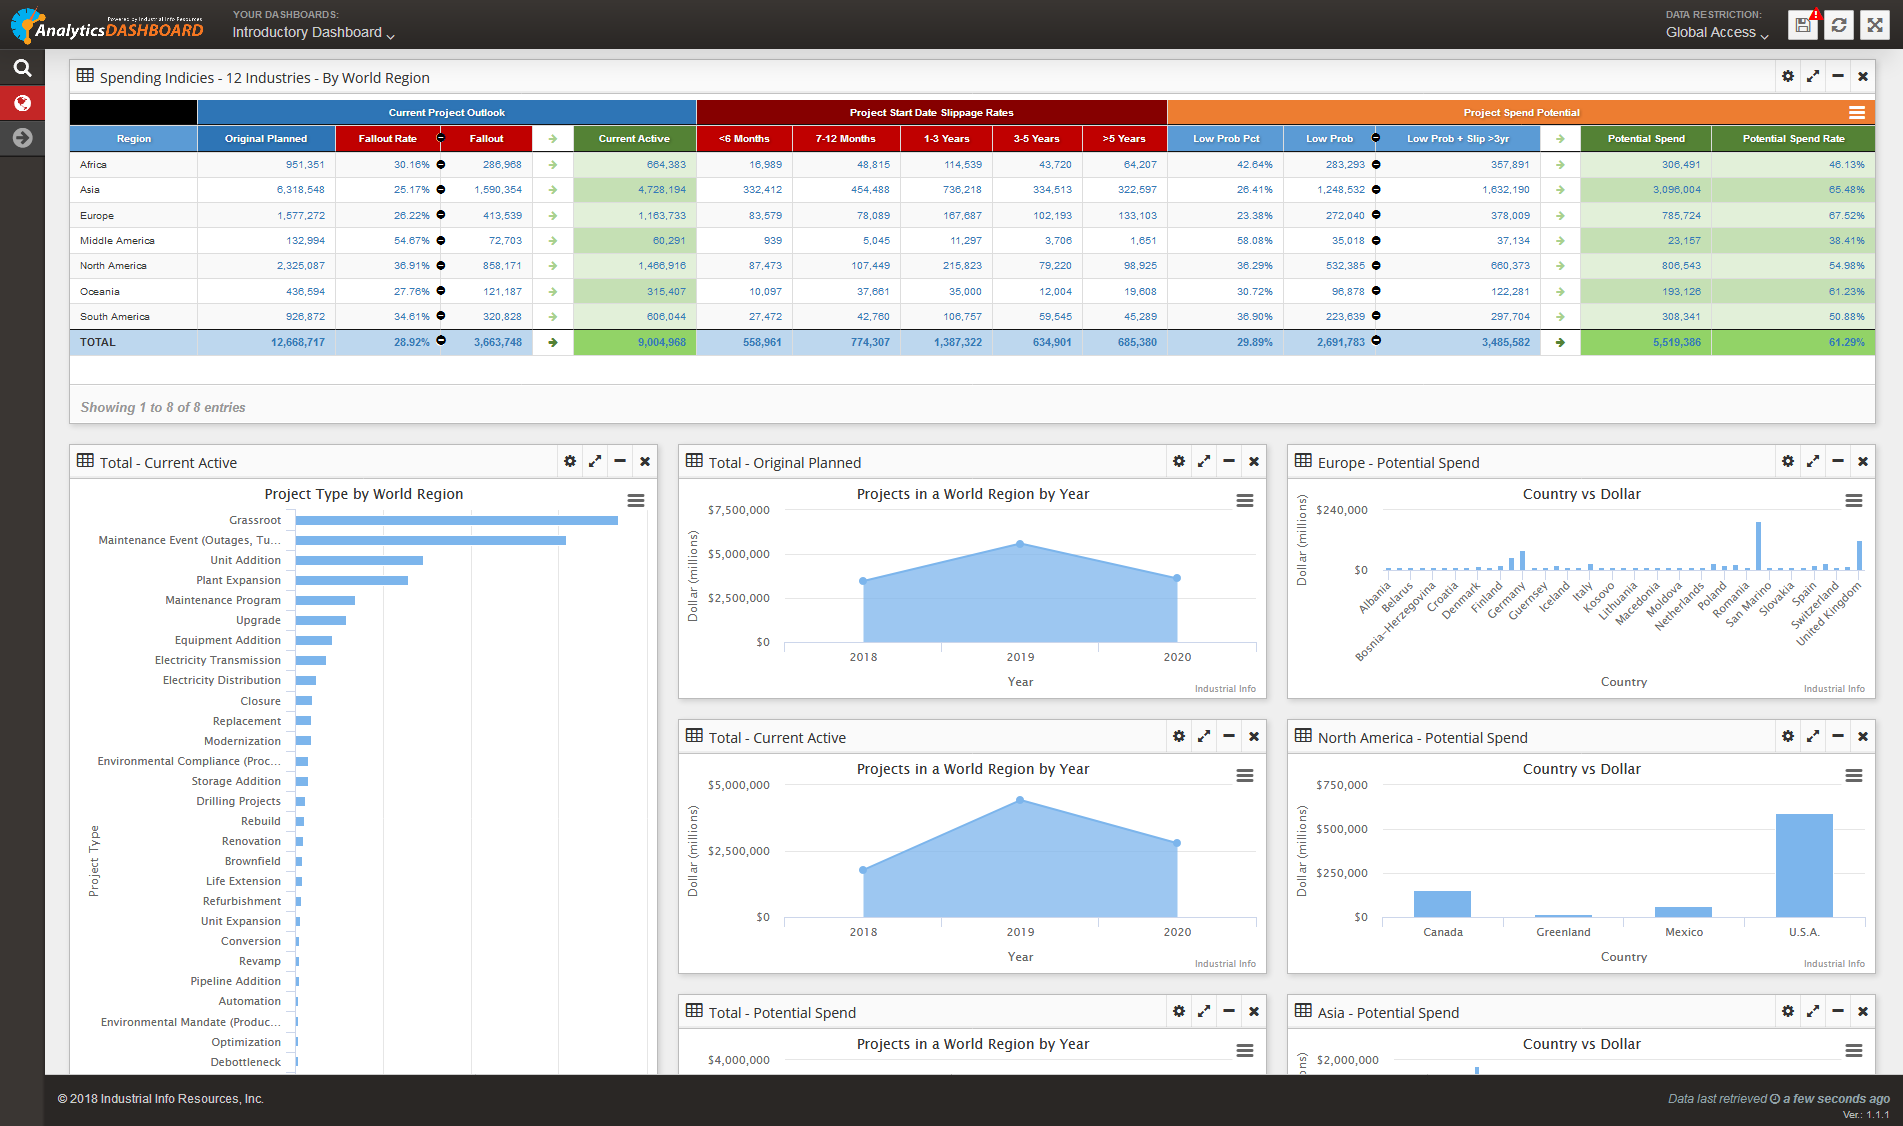
Analytics Dashboards

Blurring the Lines Between Data and Analytics

Product Options

The Analytics Dashboard can be accessed a couple of different ways:

For Current PECWeb Project Subscribers
  • The Analytics Dashboard is available as a value-added feature for projects within your current coverage. All users have access to the 30,000-foot view or topline indicators and indices, including those areas outside of your current project coverage.
For Non-PECWeb Subscribers
  • The topline Dashboard can be purchased as a standalone product for those clients who do not need to access the direct project detail.

What are they?

IIR's Analytics Spending Dashboard provides a top-down statistical view across various project spending indicators and indices across single or multiple geographies, industries or industry segments. The Analytics Dashboard enables our clients to make better, more informed decisions by helping them understand the size, shape and timing of active spending events as well as the topline outlook in the industrial market. Users can quickly drill down from that 30,000-foot view to the 1-foot individual project detail within a few clicks.

Industrial Spending Forecasts
Customized Dashboard
Grassroot and In-plant Capital & Maintenance Spending
Project Spending Indicators and Indices
Ability to drill from the 30,000-foot view to the 1-foot project level