Released May 21, 2019 | SUGAR LAND
en
Researched by Industrial Info Resources (Sugar Land, Texas)--Industrial Info's North American Industrial Project Spending Index, which measures the value of active projects in the pipeline for the year, registered a 19.15% increase in April compared with the same month in 2018. The active project value was $607.23 billion, up $97.6 billion from the total in April 2018.
The Project Spending Index is a monthly indicator that compares planned industrial project spending for the current year to the previous year in order to get a measure of growth or contraction in the industrial market. The index provides spending details by industry and market region, including monthly updates that measure the rate of activity from this year to last year during the same month. The April spending index registered gains in eight out of the 12 industries tracked by Industrial Info.
 Click on the image at right to view the April project spending index by market region.
Economic activity in the U.S. manufacturing sector expanded in April, and the overall economy grew for the 120th consecutive month, according to the Institute of Supply Management's (ISM) Report on Business. The report reflects "continued expanding business strength, but at the softest levels since the fourth quarter of 2016," the ISM said.
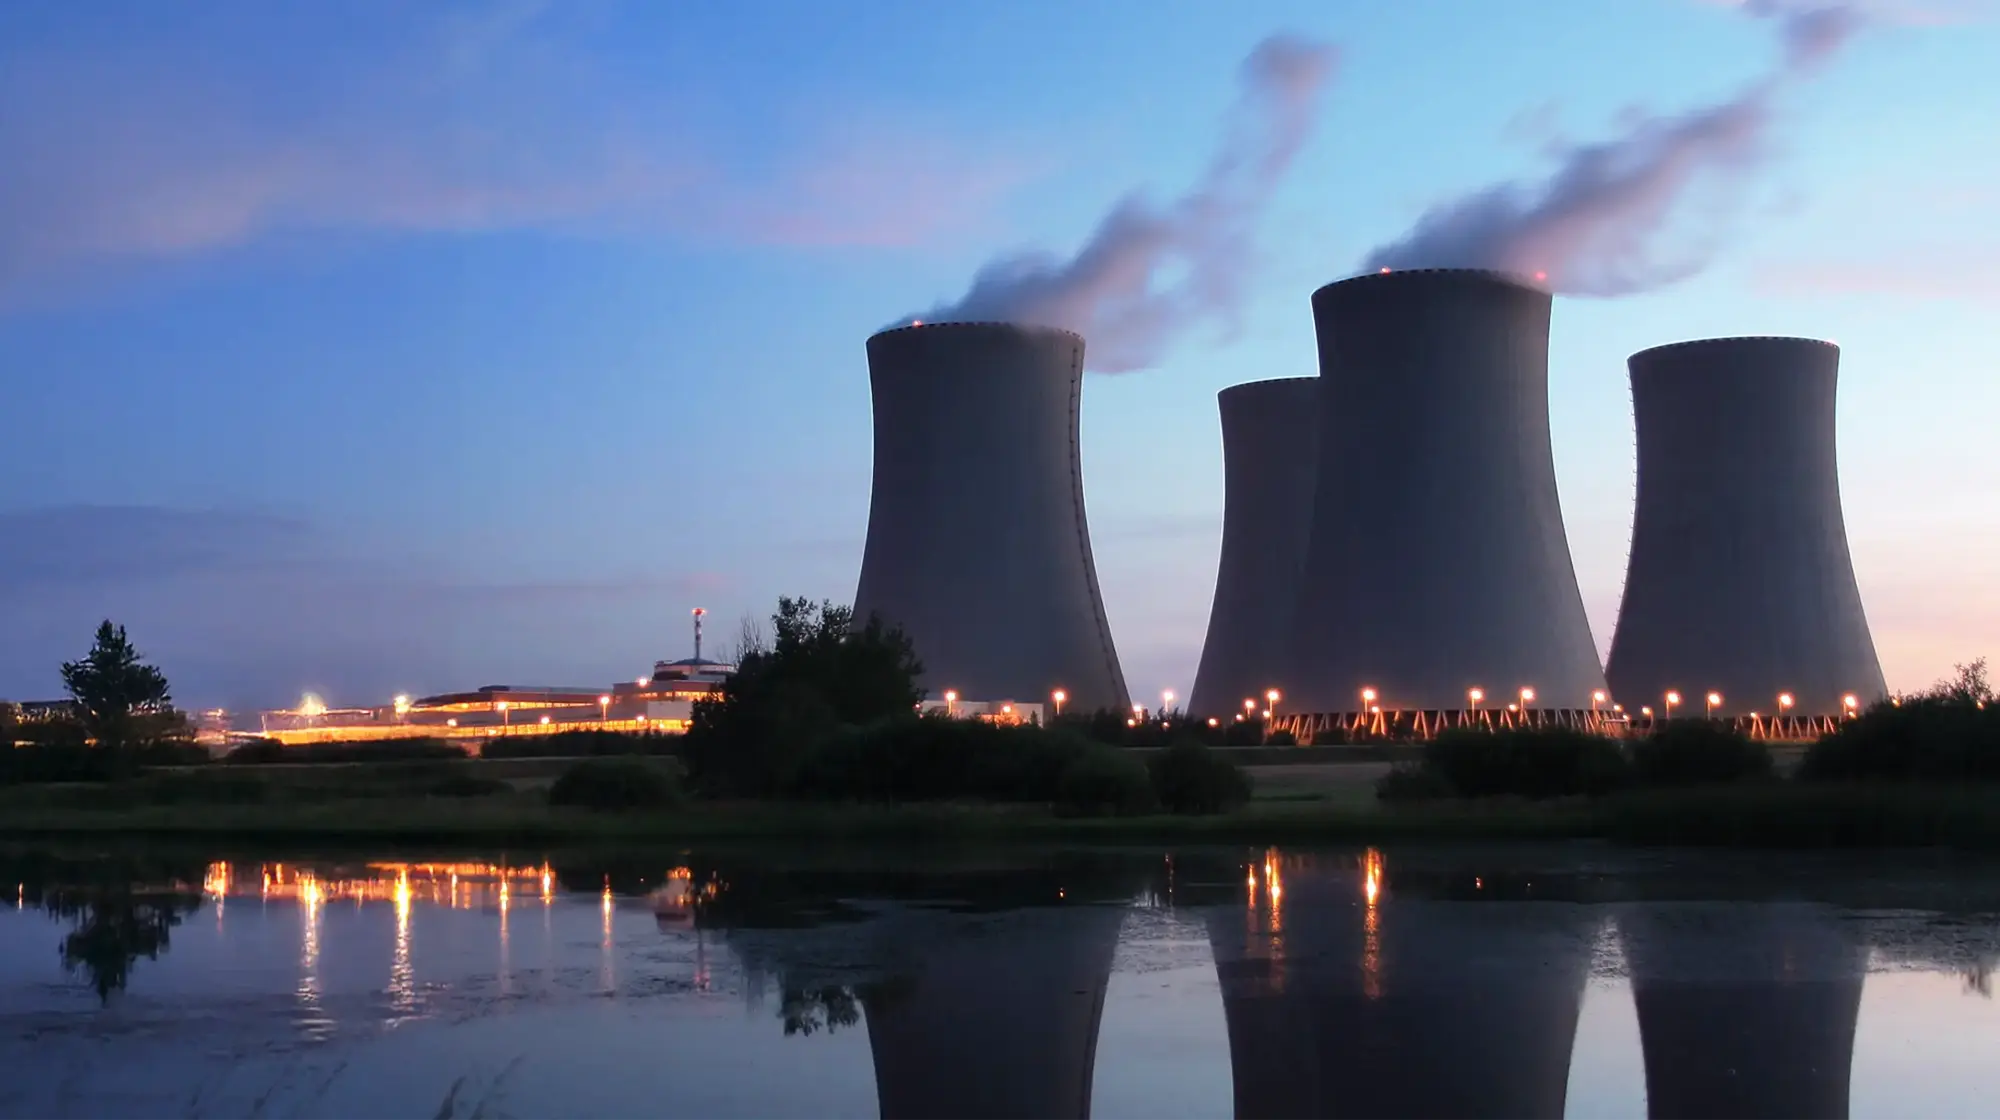
The Power Industry registered a 37.38% year-on-year gain in the Project Spending Index, totaling $134.83 billion. U.S. project developers announced new power windfarms with a total capacity of 6,146 megawatts (MW) in the first quarter of 2019, bringing the construction and advanced development pipeline to a record 39,161 MW, the American Wind Energy Association (AWEA) said in April. Wind power developers are racing to begin construction of windfarms before the end of 2019, so owners can benefit from the Production Tax Credit, which is scheduled to cease by the end of the year. For more information, see April 30, 2019, article - AWEA: Newly Announced U.S. Windfarms Reach 6,164 MW in First Quarter.
The U.S. Energy Information Administration (EIA) expects that U.S. wind capacity additions in 2019 will total 12.7 gigawatts (GW), exceeding annual capacity additions for the previous six years but falling short of the record 13.3 GW of wind capacity added in 2012. For related information, see May 2, 2019, article - More than $16 Billion in Wind, Solar Projects to Wrap Up in Fourth Quarter as Key Tax Credit Set to Expire.
The Power Industry also saw the progression of a number of natural-gas-fed projects last month. Duke Energy (NYSE:DUK) (Charlotte, North Carolina) celebrated the opening of the $1.5 billion 1,640-megawatt Citrus Combined Cycle Station located at the 5,100-acre Crystal River Energy Complex in Citrus County, Florida. For more information, see Industrial Info's project report and May 13, 2019, article - Duke Energy Moves Toward Cleaner Footprint with Natural Gas, Solar Projects.
Construction Starts
However, Industrial Info's North American Construction Starts Index amounted to 5,172 projects worth $82.97 billion for April, down from 5,210 projects valued more than $91.67 billion a year earlier. The index measures the amount of project activity that has been funded and started construction this year. The total value of the construction starts fell in eight of the 12 industries from a year earlier.
 Click the icon at right for a graph showing April North American Construction Starts.
Oil & Gas Production and Processing accounted for 227 project starts valued at $5.15 billion, down from 345 projects valued at $9.32 billion a year earlier. A number of big liquefied natural gas (LNG) processing and export projects are wrapping up this year. Domestic LNG export capacity will nearly double in 2019, increasing from 3.6 billion cubic feet per day (Bcf/d) at the beginning of the year to about 7 Bcf/d by the end of the year, according to the Federal Energy Regulatory Commission's (FERC) Summer 2019 Reliability and Energy Market Assessment. For related information, see April 30, 2019, article - McDermott's Backlog Soars as Company Approaches Completion of Key U.S. LNG Projects.
Industrial Info Resources (IIR), with global headquarters in Sugar Land, Texas, six offices in North America and 12 international offices, is the leading provider of global market intelligence specializing in the industrial process, heavy manufacturing and energy markets. Industrial Info's quality-assurance philosophy, the Living Forward Reporting Principle, provides up-to-the-minute intelligence on what's happening now, while constantly keeping track of future opportunities. Follow IIR on: Facebook - Twitter - LinkedIn. For more information on our coverage, send inquiries to info@industrialinfo.com or visit us online at http://www.industrialinfo.com.
The Project Spending Index is a monthly indicator that compares planned industrial project spending for the current year to the previous year in order to get a measure of growth or contraction in the industrial market. The index provides spending details by industry and market region, including monthly updates that measure the rate of activity from this year to last year during the same month. The April spending index registered gains in eight out of the 12 industries tracked by Industrial Info.
Economic activity in the U.S. manufacturing sector expanded in April, and the overall economy grew for the 120th consecutive month, according to the Institute of Supply Management's (ISM) Report on Business. The report reflects "continued expanding business strength, but at the softest levels since the fourth quarter of 2016," the ISM said.
The Power Industry registered a 37.38% year-on-year gain in the Project Spending Index, totaling $134.83 billion. U.S. project developers announced new power windfarms with a total capacity of 6,146 megawatts (MW) in the first quarter of 2019, bringing the construction and advanced development pipeline to a record 39,161 MW, the American Wind Energy Association (AWEA) said in April. Wind power developers are racing to begin construction of windfarms before the end of 2019, so owners can benefit from the Production Tax Credit, which is scheduled to cease by the end of the year. For more information, see April 30, 2019, article - AWEA: Newly Announced U.S. Windfarms Reach 6,164 MW in First Quarter.
The U.S. Energy Information Administration (EIA) expects that U.S. wind capacity additions in 2019 will total 12.7 gigawatts (GW), exceeding annual capacity additions for the previous six years but falling short of the record 13.3 GW of wind capacity added in 2012. For related information, see May 2, 2019, article - More than $16 Billion in Wind, Solar Projects to Wrap Up in Fourth Quarter as Key Tax Credit Set to Expire.
The Power Industry also saw the progression of a number of natural-gas-fed projects last month. Duke Energy (NYSE:DUK) (Charlotte, North Carolina) celebrated the opening of the $1.5 billion 1,640-megawatt Citrus Combined Cycle Station located at the 5,100-acre Crystal River Energy Complex in Citrus County, Florida. For more information, see Industrial Info's project report and May 13, 2019, article - Duke Energy Moves Toward Cleaner Footprint with Natural Gas, Solar Projects.
Construction Starts
However, Industrial Info's North American Construction Starts Index amounted to 5,172 projects worth $82.97 billion for April, down from 5,210 projects valued more than $91.67 billion a year earlier. The index measures the amount of project activity that has been funded and started construction this year. The total value of the construction starts fell in eight of the 12 industries from a year earlier.
Oil & Gas Production and Processing accounted for 227 project starts valued at $5.15 billion, down from 345 projects valued at $9.32 billion a year earlier. A number of big liquefied natural gas (LNG) processing and export projects are wrapping up this year. Domestic LNG export capacity will nearly double in 2019, increasing from 3.6 billion cubic feet per day (Bcf/d) at the beginning of the year to about 7 Bcf/d by the end of the year, according to the Federal Energy Regulatory Commission's (FERC) Summer 2019 Reliability and Energy Market Assessment. For related information, see April 30, 2019, article - McDermott's Backlog Soars as Company Approaches Completion of Key U.S. LNG Projects.
Industrial Info Resources (IIR), with global headquarters in Sugar Land, Texas, six offices in North America and 12 international offices, is the leading provider of global market intelligence specializing in the industrial process, heavy manufacturing and energy markets. Industrial Info's quality-assurance philosophy, the Living Forward Reporting Principle, provides up-to-the-minute intelligence on what's happening now, while constantly keeping track of future opportunities. Follow IIR on: Facebook - Twitter - LinkedIn. For more information on our coverage, send inquiries to info@industrialinfo.com or visit us online at http://www.industrialinfo.com.